October 2013
|
October 2013 // Volume 51 // Number 5 // Tools of the Trade // v51-5tt4


Developing a Customized GIS-Based Spatial Statistics Tool: An Application to Emergency Planning and Response
Abstract
Increased access to geographic information systems (GIS) technology has expanded the tools available to support Extension programming. However, working with large spatial datasets can still be difficult for less experienced users. GIS software allows the use of custom script programs and toolboxes to expedite and simplify data analysis. This article demonstrates the use of a customized GIS-based spatial statistics tool in an emergency planning and response context. In our example, we use the tool to tabulate population statistics within a user-defined area around several supermarkets made inoperable due to flooding.
The evolution and increased access to geographic information systems (GIS) technology has expanded the range of tools available to support Extension programming (Milla, Lorenzo, & Brown, 2005). However, generating statistics from large spatial datasets can still be time-consuming and difficult for less experienced users. Fortunately, many analyses in ArcMap GIS software can be automated and simplified through the use of custom script programs and toolboxes. These toolboxes can expedite data analysis and assist Extension personnel with limited familiarity with the software.
This article demonstrates the use of a customized GIS-based spatial statistics tool used in emergency planning and response for tabulating population statistics (i.e., number of residents) within a user-defined area. Sallee and Allen (2011) recently shared a youth-oriented initiative for facilitating emergency readiness in Oklahoma with the use of GIS technology. We detail a GIS tool developed to allow emergency response personnel to quickly and easily analyze data within a specified distance of single or multiple point locations.
The Scenario
The tool was created as part of an incident annex to the New Jersey Emergency Operations Plan designed to facilitate continuity of operations in the food distribution sector during an emergency. In the case of a disruption, however, rapidly accessing information on the number of individuals dislocated from local food access would aid emergency planning and response personnel. To demonstrate the use of the spatial statistics tool, assume, for example, that several supermarkets are made inoperable due to an emergency event (e.g., severe localized flooding or power failure). Information needs may include: how many total residents are affected? Or how many affected residents are elderly or children?
Development of the Tool
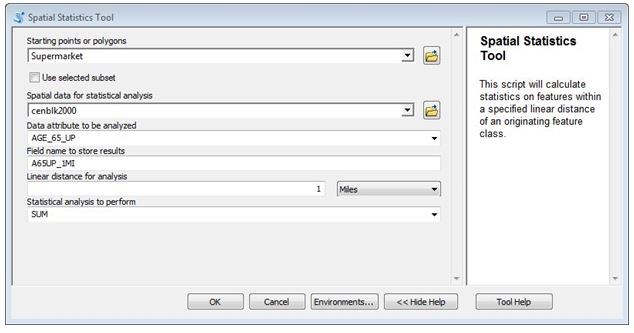
A Spatial Statistics Tool was developed to perform basic tabulations of population characteristics within a user-specified linear distance from selected points (supermarkets) of interest. This custom tool was developed using the Python scripting language. An ESRI ArcGIS toolbox front-end was also developed to provide a user-friendly interface to interact with the custom script (Figure 1).
Figure 1.
Spatial Statistics Tool—User Interface
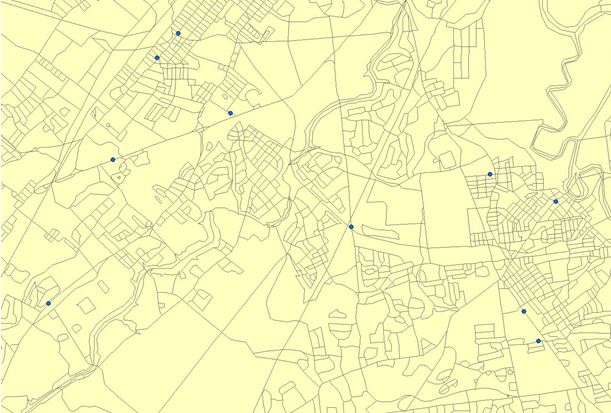
The tool analyzes data consisting of polygons representing census blocks containing data on population characteristics imported from the 2000 U.S. Census of Population and spatial coordinates of major supermarket chain locations (Figure 2).
Figure 2.
GIS Data Showing Census Blocks and Supermarket Locations
The user interface fields displayed in Figure 1 are defined as follows.
Starting points or polygons refer to the data points or polygons (2-dimensional shapes) around which population statistics will be analyzed. In our example, "Supermarket" is an option corresponding to point data on the location of approximately 700 New Jersey supermarkets.
Use selected subset is an option allowing the user to define a subset of all points of interest (i.e., one or more selected supermarket locations) that will be analyzed. In our example, we select 10 supermarket locations.
Spatial data for statistical analysis represents the spatial dataset to be analyzed. In this example, "cenblk2000" refers to polygon data representing the 2000 U.S. Census Blocks, with corresponding demographic data.
Data attribute to be analyzed refers to the specific dataset field to be analyzed. In this example, "AGE_65_UP" is a field containing data on the number of people within the census block that are over the age of 65.
Field name to store results creates a new field name that is added to the starting points or polygons dataset, under which results from the statistical analysis are stored. In this example, we have chosen the name "A65UP_1MI" to indicate that we analyzed the population over the age of 65 within a 1-mile radius of each supermarket point location.
Linear distance for analysis is a user-defined value representing the linear distance used to create the area around the starting points or polygons, within which data will be analyzed. In our example we chose 1 mile, so data in all census blocks within a 1-mile radius of each selected supermarket location will be summarized. Linear distance is measured from the center of point features and from the outer border of polygon features.
Statistical analysis to perform allows the user to select the types of statistical analysis to be performed on the values of the selected features that fall within the specified distance from the defined starting point. In our example, the query tool will sum the number of persons over the age of 65 within 1 mile of the defined supermarket locations. Common statistical functions built into the tool include:
SUM - Calculate the sum of the values.
MEAN - Calculate the average of the values.
STD - Calculate the standard deviation of the values.
MIN - Return the minimum value.
MAX - Return the maximum value.
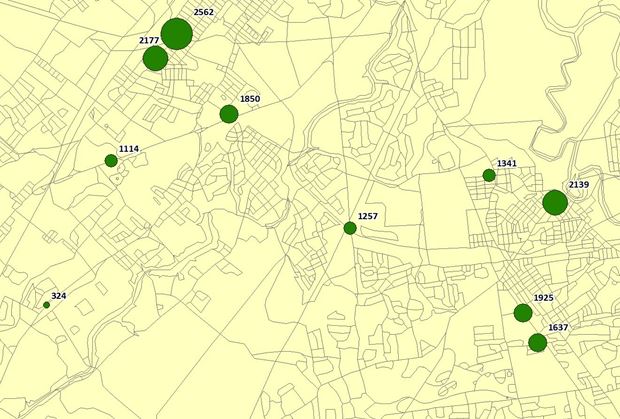
Upon execution, the custom script loops through each individual point in the supermarket dataset. In our example, an algorithm generates a 1-mile buffer around each supermarket location. The tool selects all census block polygons that have their centroid (center point) within the buffer. The statistical analysis is then performed on the selected data attributes and stored under the newly defined field name (the last column titled "A65UP_1MI" in the screen capture displayed in Figure 3). The results in this field can then be displayed in a map (Figure 4) or exported as a table for further analysis. The tool can be run numerous times on different attributes of the census blocks allowing for multiple analyses to be stored in the supermarket dataset for later use.
Figure 3.
Spatial Statistics Tool—Results from Analysis
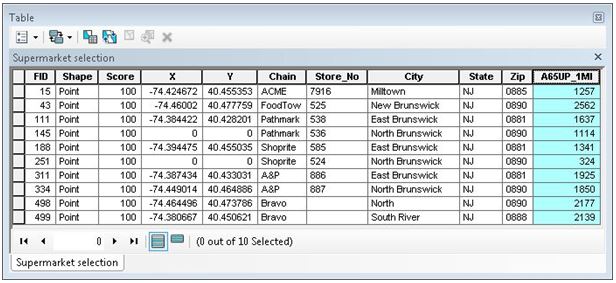
Figure 4.
Tabulation of Residents (65 Years or Older) Affected by Disruption in Supermarket Operations
Summary
This article demonstrates the use of a customized GIS-based tool for quantifying a population count within a specified area(s). While presented in the context of an emergency planning exercise, the tool also has broader applications. As an example of its value in agricultural marketing, the number and demographic characteristics of residents living within a certain distance of a farmer's retail market can easily be summarized. Similarly, the affluence or ethnic composition of potential customers can easily be summarized to evaluate the attractiveness of multiple target market areas (e.g., community farmers markets).
References
Milla, K. A., Lorenzo, A., & Brown, C. (2005). GIS, GPS, and remote sensing technologies in Extension Services: Where to start, what to know. Journal of Extension [On-line], 43(3) Article 3FEA6. Available at: http://www.joe.org/joe/2005june/a6.php
Sallee, J., & Allen, K. (2011). Youth GIS partnerships in action: Alert, evacuate, and shelter. Journal of Extension [On-line], 49(5) Article 5IAW3. Available at: http://www.joe.org/joe/2011october/iw3.php