October 2013
|
October 2013 // Volume 51 // Number 5 // Research In Brief // v51-5rb9


Comparing Three Different Methods for Assessing Corn Silage Density
Abstract
Silage density is negatively correlated with dry matter losses in storage and has been used as an Extension evaluation tool to assess ensiling management practices on farms. We compared three methods for estimating silage density on 18 farms. Core sampling is the standard method, while the calculator and feed-out methods are new alternative methods. Core sampling results were highly correlated with the calculator method but not with the feed-out method. Core sampling and the calculator method are recommended tools for estimating storage dry matter losses and evaluating alternative ensiling management practices by Extension faculty, producers, and other users.
Introduction
Silage density measurements are an important management tool on livestock operations. Dry matter losses during storage and during feed-out are directly related to silage density, and measurement of density can be used to estimate dry matter losses on farm (Ruppel, 1992, 1997). For optimal performance, dry matter density should equal 15 pounds per cubic foot or higher (Muck & Holmes, 2000). Surveys of commercial silage storages have been conducted by Extension faculty (Muck & Holmes, 2000; Vokey, 2002; Craig & Roth, 2005) and by allied industry (Oelberg, Harms, Ohman, Hinen, & Defrain, 2006; Visser, 2005) using the core sampling technique. Commercial storages are typically close to the recommended silage density on average, but there is considerable variation among farms and significant room for improvement on many operations.
Extension faculty at the University of Wisconsin have developed two new tools for measuring silage density: a calculator method and a feed-out method. Data from their field trial in 2000 was used to develop a regression equation for estimating silage density (Muck & Holmes, 2000), and this information was incorporated into a spreadsheet calculator (Holmes & Muck, 2000). Separate density calculators were later developed for bunker silos and silage piles (Holmes & Muck, 2007a, 2007b). Holmes has also developed a feed-out method for estimating silage density based on weight and volume of silage removed from storage (personal communication, September 12, 2005). The three silage density measurement procedures and their respective limitations are discussed below.
Core sampling is the standard method for determining silage density. The method has a high degree of accuracy but also has several limitations. Core sampling requires investment in a sampling probe, a high voltage portable drill, and an accurate electronic scale. Core samples are collected from the face of the silage mass, and there is a safety risk that the silage mass may avalanche onto the individuals collecting samples. It is a time-consuming process, particularly when multiple storages are evaluated. Finally, density measurements vary by location in the structure, with higher densities near the bottom of the storage and lower densities near the sidewalls of the bunker silo. Multiple samples are required to adequately reflect this variation and to more accurately predict average silage density.
The calculator method estimates average silage density based on entered inputs to a spreadsheet. The calculator method can be used at any time, has minimal safety concerns, is time efficient, and allows "what if" comparisons of various management practices. However, there are challenges with using the silage density calculator. It requires very specific inputs that may not be readily available, such as number of packing tractors, tractor weights, layer thickness, harvest rate, percent packing time, dry matter content, and height of silage within storage.
The feed-out method is performed over a period of time on the farm. The method involves weighing the amount of silage removed during the test period and estimating the volume of silage removed by first calculating surface area of the silage face and then measuring the distance that the silage face has moved during the test period. Average density is calculated by dividing the weight of silage removed by the estimated volume of silage removed. The feed-out method has limited safety concerns and is time efficient. However, it does require accurate scales, a commitment to record daily silage removal weights, and a smooth, vertical silage face at the beginning and end of the test period.
Several field surveys have been conducted on commercial operations using the core sampling method, but no one has yet field-tested the feed-out method, nor have the three density methods been compared side by side on the same storage structures. Due to the inherent safety risk of core sampling, it was deemed important to evaluate the alternative methods for estimating density. Our objective in the demonstration trial was to compare the three silage density procedures from Wisconsin on Idaho dairy operations and determine their utility for assessing density in Idaho. Field demonstrations are a proven method for increasing awareness and adoption of new management practices (Price, Carpenter-Boggs, & Goldberg, 2009; Stup, Van Saun, & Wolfgang, 2002).
Methods
Eighteen storage structures on 18 farms were enrolled in the study (Table 1). Core samples were collected with a Master Forage probe (DairyOne, Ithaca, NY) during each of two farm visits (10- to 14-day intervals). Core samples were collected at mid height of the silage mass: one at the center and one on each side within 10 feet of the wall or edge of the silage pile. Each core sample was weighed, and the depth of core was measured at the silage face. Core samples were pooled, and a subsample was collected for submission to a commercial feed testing laboratory for dry matter analysis. Dry matter density was calculated by dividing the dry weight of the sample by the volume of the sample core. A mean core density was determined at each farm visit by averaging density across the three sampling locations. Silage density was measured twice on each storage with the core sampling method to provide an estimate of repeatability between observations.
| Storage characteristics | Mean density (pounds/cubic foot) | ||||
| Type | Width (ft) | Height (ft) | Core Sampling | Calculator Method | Feed-out Method |
| Bunker | 28.0 | 10.5 | 13.0 | 12.5 | 22.5 |
| Bunker | 28.0 | 11.0 | 15.0 | 14.1 | 10.0 |
| Bunker | 30.0 | 12.0 | 14.2 | 13.7 | 16.7 |
| Bunker | 30.0 | 15.0 | 15.5 | 15.2 | 11.3 |
| Bunker | 31.0 | 12.5 | 13.7 | 13.5 | 21.6 |
| Bunker | 38.0 | 11.5 | 15.0 | 14.4 | 20.6 |
| Bunker | 39.0 | 10.0 | 15.5 | 15.0 | 16.8 |
| Bunker | 54.0 | 14.5 | 13.6 | 16.1 | 14.8 |
| Bunker | 112.0 | 20.0 | 12.6 | 12.8 | 8.5 |
| Pile | 34.0 | 11.0 | 14.2 | 13.2 | 12.9 |
| Pile | 37.0 | 14.0 | 14.2 | 14.7 | 16.0 |
| Pile | 77.0 | 14.0 | 15.9 | 17.0 | 11.8 |
| Pile | 91.0 | 16.8 | 17.3 | 21.7 | 15.2 |
| Pile | 98.8 | 13.7 | 15.3 | 13.4 | 22.9 |
| Pile | 112.0 | 20.0 | 12.6 | 12.8 | 23.5 |
| Pile | 125.0 | 15.0 | 13.9 | 14.0 | 11.3 |
| Bunker/Pile | 42.0 | 8.7 | 10.4 | 13.3 | 15.1 |
| Bunker/Pile | 52.0 | 15.0 | 16.0 | 16.5 | 19.5 |
| Mean density | 14.3a | 14.7a | 16.2a | ||
| Std.Error | 0.4 | 0.5 | 1.1 | ||
|
aMeans with identical letters are not different (p>0.05). |
|||||
The calculator method involved entering data into a spreadsheet for estimating density in bunker silos (Holmes & Muck, 2007a) and silage piles (Holmes & Muck, 2007b). Producers or custom contractors were interviewed to obtain the majority of the required inputs for the density calculator, including: silage loading rate, layer thickness, number of packing tractors, tractor weights, and percent packing time for each tractor. Height of the bunker wall and peak height of the silage mass were measured during each farm visit.
For the feed-out method, silage face measurements were obtained during three farm visits at 10- to 14-day intervals. Producers reported the weight of silage removed from the storage structure over the 10- to 14-day test interval. Density was calculated by dividing the dry weight of silage fed by the estimated volume of silage removed during the interval between farm visits. Silage density was estimated twice on each storage with the feed-out method to provide an estimate of repeatability between observations.
All statistical comparisons were conducted in SAS (SAS Institute, 2010). Mean density data were analyzed as a randomized block design with storages as blocks and methods as treatments. Variances for each estimation method were compared using the folded F test in Proc TTEST. Due to unequal variances between estimation methods, a nonparametric analysis of variance was also used to compare mean densities. Density measurements were ranked within storage using Proc RANK, and means were tested using Friedman's two-way non-parametric analysis of variance in Proc ANOVA. Correlations between methods were determined with Proc CORR. Repeated measures of core sample density and feedout density were compared using paired t-tests in Proc TTEST.
Results
Data were collected from nine bunker silos, seven drive-over silage piles, and two combination bunker-piles. Characteristics of each storage structure and mean density measurements by method within storage facility are shown in Table 1. Mean silage density did not vary significantly between the three silage density methods with either the randomized block (p=0.19) or non-parametric analysis (p=0.68). Variation in density between storages was significantly higher for the feed-out method than core sampling or calculator methods (p<0.001). Using our reported means, variance, sample size, and an alpha of 0.05, we calculated the statistical power of our study. The power to detect a two-pound difference in density was 88.7% when comparing core sampling versus calculator method and 50.6% when comparing core sampling versus the feed-out method.
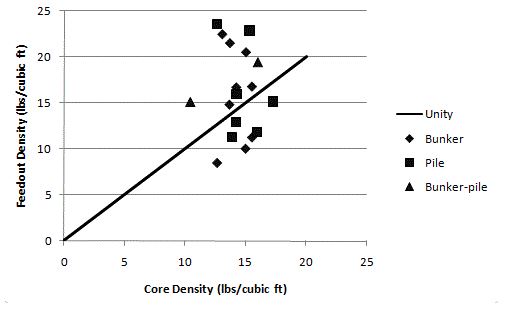
Core density measurements were highly correlated with calculator estimates (r = 0.71, p<0.001, Figure 1) but not with feed-out density estimates (r = -0.06, p=0.82, Figure 2). Core sampling and calculator density estimates were within plus or minus one pound for 13 out of 18 storages and within plus or minus two pounds for 15 out of 18 storages (Figure 1). Conversely, none of the feed-out density measurements were within plus or minus one pound of core sample densities and only four out of 18 storages were within plus or minus two pounds of core density measurements (Figure 2).
Figure 1.
Predicted Silage Density by the Calculator Method Plotted Against Mean Core Sample Density for each Storage Structure
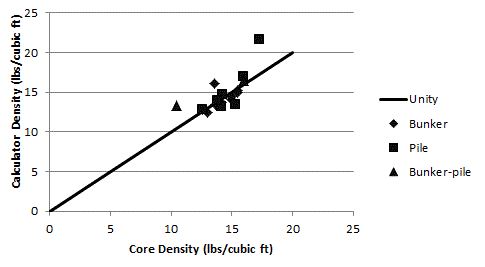
Figure 2.
Predicted Silage Density by the Feed-out Method Plotted Against Mean Core Sample Density for each Storage Structure
Repeated measures were available for both core sampling and feed-out methods (Table 2). Mean difference and standard error of the difference (SEdiff) were two to three times larger for repeated measures with the feed-out method (1.4±1.5) than for repeated core samples (-0.7±0.4). Differences between repeated density measurements were less than two pounds for 14 out of 18 storages with core sampling and less than two pounds for 7 out of 18 storages with feed-out method. Core sampling has a reasonable degree of repeatability while the feed-out method was too variable between repeated measures.
| Storage | Core Sampling | Feed-out Method | ||||
| Type | Rep 1 | Rep 2 | Difference | Rep 1 | Rep 2 | Difference |
| Bunker | 13.3 | 12.8 | 0.5 | 22.7 | 22.4 | 0.3 |
| Bunker | 14.2 | 15.7 | -1.5 | 11.6 | 8.5 | 3.1 |
| Bunker | 13.1 | 15.2 | -2.1 | 15.5 | 18.0 | -2.5 |
| Bunker | 15.3 | 15.7 | -0.3 | 10.9 | 11.6 | -0.6 |
| Bunker | 13.8 | 13.6 | 0.2 | 21.8 | 21.4 | 0.4 |
| Bunker | 15.9 | 14.1 | 1.7 | 24.8 | 16.3 | 8.6 |
| Bunker | 15.3 | 15.7 | -0.5 | 14.4 | 19.2 | -4.7 |
| Bunker | 13.2 | 14.0 | -0.9 | 16.4 | 13.3 | 3.1 |
| Bunker | 12.1 | 13.1 | -1.0 | 7.3 | 9.7 | -2.4 |
| Pile | 13.9 | 14.5 | -0.6 | 14.7 | 11.1 | 3.5 |
| Pile | 14.5 | 13.9 | 0.6 | 17.1 | 14.9 | 2.2 |
| Pile | 13.9 | 18.0 | -4.1 | 11.4 | 12.2 | -0.8 |
| Pile | 17.9 | 16.7 | 1.2 | 15.9 | 14.4 | 1.4 |
| Pile | 14.7 | 15.9 | -1.2 | 22.2 | 23.5 | -1.3 |
| Pile | 10.1 | 15.1 | -5.0 | 32.0 | 15.1 | 16.9 |
| Pile | 12.6 | 15.2 | -2.6 | 4.6 | 18.0 | -13.4 |
| Bunker/Pile | 10.6 | 10.2 | 0.4 | 19.9 | 10.4 | 9.5 |
| Bunker/Pile | 16.8 | 15.1 | 1.7 | 20.2 | 18.8 | 1.4 |
| Mean | -0.7 | 1.4 | ||||
| SD diff | 1.8 | 6.3 | ||||
| SE diff | 0.4 | 1.5 | ||||
| Significance | NS | NS | ||||
Discussion
Core sampling and calculator densities were generally in close agreement, which suggests Extension faculty can assist producers by using the density calculator in the office rather going out to the storage structure. The density calculator over-predicted silage density by three or more pounds on three storages (Figure 1). The over-predication was not related to storage type since it occurred once for all three storage types. Obtaining reliable inputs for the calculator method is critical for reasonable predictions with the silage density calculators.
The feed-out method did not perform satisfactorily in our study, being poorly correlated with the standard method and highly variable with repeated measurements. Poor results are most likely due to non-uniform silage faces on farms and the inherent challenges in accurately measuring volume of silage fed at the farm level. Silage defacers provide a more uniform silage face than conventional silage removal with a tractor-mounted bucket. Accuracy of the feed-out method may be better on operations with silage defacers, but defacers are very uncommon in Idaho, and we were not able to perform an evaluation on farms.
All three methods provide challenges for Extension field staff when collecting data and advising producers. Core sampling requires purchase of sampling equipment and significant time to collect samples. The calculator method can be done at the office, but it is challenging to obtain reliable inputs, particularly for tractor weights, layer thickness, and silage harvest rate. Stock tractor weights can frequently be found on the Web, but added weights must be estimated, including the weight of dual tires. The feed-out method requires time to train farm workers on how to properly collect dimensions of the silage face, set markers for evaluating movement of the face, and record feed load out data.
Conclusions
Core sampling is recommended for directly assessing silage density, and the calculator method is recommended for estimating average density and for evaluating alternative management strategies during the silo filling and packing process. The feed-out method performed poorly and is not recommended unless the storage structure has uniform silage faces and easy-to-measure movements in the silage face
References
Craig, P. H., & Roth, G. (2005): Penn State University bunker silo density study summary report 2004-2005. Pennsylvania State University Cooperative Extension-Dauphin County. Retrieved from: http://cornandsoybeans.psu.edu/pdfs/bunker_silo_study.pdf.
Holmes, B. J., & Muck, R. E. (2000). Silage density calculator. University of Wisconsin Team Forage webpage. Retrieved from: http://www.uwex.edu/ces/crops/uwforage/storage.htm
Holmes, B. J., & Muck, R. E. (2007a). Bunker silo density calculator. University of Wisconsin Team Forage webpage. Retrieved from: http://www.uwex.edu/ces/crops/uwforage/storage.htm
Holmes, B. J., & Muck, R. E.(2007b). Silage pile density calculator. University of Wisconsin Team Forage webpage. Retrieved from: http://www.uwex.edu/ces/crops/uwforage/storage.htm
Muck, R. E., & Holmes, B. J. (2000). Factors affecting bunker silo densities. Applied Engineering in Agriculture 15(6): 613-619.
Price, C., Carpenter-Boggs, L., & Goldberg, J. (2009). On-farm mortality composting in Washington State: Outreach and Producer Survey. Journal of Extension [On-line], 47(6) Article 6RIB8. Available at: http://www.joe.org/joe/2009december/rb8.php
Oelberg, T., Harms, C, Ohman, D., Hinen, J., & Defrain, J.(2006). Survey shows more packing of bunkers and piles needed. Proceedings of High Plains Dairy Conference, Albuquerque, NM. Pages 47-53. Retrieved from: http://www.highplainsdairy.org/2006/Hinen.pdf
Ruppel, K. A. (1992). Effect of bunker silo management on hay crop nutrient preservation. M.S. Thesis. Cornell University, Ithaca, NY.
Ruppel, K. A. (1997). Economics of silage management practices: What can I do to improve the bottom line of my ensiling business? Silage: Field to Feedbunk (NRAES-99). Northeast Regional Agricultural Engineering Service, Ithaca, NY.Pages 125-136.
SAS Institute. (2010). SAS/STAT User's Guide: Statistics, Version 9. SAS Institute Inc, Cary, NC.
Stup, R., Van Saun, R., & Wolfgang D. (2002). A promising new role for Extension educators in a dynamic industry: The Cow Sense project. Journal of Extension [On-line], 40(6) Article 6FEA5. Available at:http://www.joe.org/joe/2002december/a5.php
Visser, B. (2005). Forage density and fermentation variation: A survey of bunkers, piles, and bags across Minnesota and Wisconsin dairy farms. Proceedings of the Four State Dairy Nutrition and Management Conference, Dubuque, IA, USA.Pages 233-240.
Vokey, F. (2002). Bunk silo management & silage quality: Results from 14 Lewis County dairies. Cornell Cooperative Extension, Lewis County. Retrieved from: http://counties.cce.cornell.edu/lewis/PDFs/Research%20Reports/2001%20Corn%20Bunk%20Silo%20Study%20-%20Report.pdf