June 2013
|
June 2013 // Volume 51 // Number 3 // Research In Brief // v51-3rb5


Credit Card Usage among Older Adults: Assessing Financial Literacy and Pressures
Abstract
The research reported here assessed the financial literacy of older adults living in rural communities, current use of and attitudes towards debt, and debt pressures. Those surveyed exhibit low credit card usage and responsible payment practices. Most never use credit to pay medical expenses. Respondents display a financial literacy level similar to the Jump$tart Coalition's 2008 college sample. While the financial situations and well-being for most are positive, those with financial pressures face some negative outcomes. Increasing financial literacy and teaching basic budgeting to a targeted segment of older adults have the potential to increase well-being and family relationships.
Introduction
According to a 2008 survey of low- and middle-income households conducted by Demos, a non-partisan public policy research and advocacy organization, Americans age 65 and older are taking on more debt as they increasingly use credit cards to finance necessary costs of living. From 2005 to 2008, there was a dramatic increase of 26% in the use of debt by this age group, the largest increase of all age groups surveyed. Further, this population reported the highest amount of credit card debt due to medical expenses. The two most cited reasons for using credit cards to pay for out-of-pocket medical expenses were for prescription drugs and dental expenses (Demos, 2009).
The increase in the use of credit cards by this age group to finance basic living expenses is not surprising given recent economic conditions. While Extension is well positioned to teach credit card management skills to this population (Miner & Harris, 1998; Porter & Christenbury, 1999; Wilde, 2011), it is important to assess local and statewide curriculum needs. Research on financial literacy in the older population has shown that a one-size-fits-all financial education program is unlikely to be successful (Lusardi & Mitchell, 2007, 2008).
Older adults with low levels of financial literacy will never develop the financial sophistication needed to understand today's complex financial products targeted to this population. Lusardi, Mitchell, and Curto (2009) measured financial sophistication in the older population by looking at five areas: knowledge of capital markets, risk diversification, knowledge of fees, financial savvy, and attitudes towards investing and risk. They found financial sophistication to be rare within their sample of older respondents over age 55, and if sophistication was demonstrated, it was limited to only one of these five areas.
The research reported here assessed the financial literacy of Oklahomans age 65 and older, their current use of and attitudes towards using credit cards, and the consequences of increased debt for this population. Because those living in more rural communities likely have less access to financial education than those living in more urban settings, the research focused on reaching older Oklahomans in rural counties. This assessment is necessary in order to develop and deliver a targeted Extension financial education curriculum to this segment of the population in Oklahoma. The long-term goal of the research is to improve financial literacy among older Oklahomans so that they can become more informed consumers and understand the risk/return tradeoff of using consumer debt. This is important to all Extension educators, including those working with older farmers and ranchers who struggle to pay bills during periods of extreme weather conditions and volatile commodity prices, and 4H youth who witness firsthand the consequences of poor family financial decision-making.
Methodology
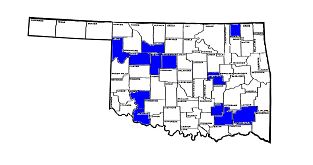
This pilot research was funded by a Donna Cadwalader Research and Development Grant from the Oklahoma Home and Community Education, Inc. Men and women age 65 and older from rural Oklahoma counties were recruited to participate by Oklahoma Cooperative Extension Family & Consumer Science educators via fliers, news releases, and personal invitation. Oklahoma counties with estimated 2008 populations under 15,000 were considered for the study. The survey collection period was from September 2010 to January 2011. There were 12 counties sampled and 106 survey participants. As shown in Figure 1, participants were recruited from all across that state.
Figure 1.
Geographic Dispersion of Oklahoma Counties Surveyed
An in-depth questionnaire based on a family process model of economic hardship (Conger et al., 1992) was administered at designated locations in each chosen county. It consisted of five parts:
- A financial literacy quiz;
- Questions regarding participants' current level of debt, type of debt, and recent changes in debt load;
- Questions regarding debt pressures and participants' perceptions of how debt affects their families;
- General questions about participants' psychosocial well-being; and
- Demographic information.
Results
Survey Characteristics
Table 1 contains a summary of survey characteristics. An overwhelming majority (85%) were not financially responsible for anyone else besides themselves and their spouse. According to the Center on Aging and Work (2008), 17.8% of Oklahomans age 55 and older have a college degree, 23.8% have some college, and 58.5% have a high school diploma or less. Survey participants closely mirror these statewide statistics, with more only having some college and less with college degrees.
| Characteristics | Mean or % |
| Age | 76 |
| Female | 74% |
| Race | |
| White | 80% |
| Native American | 13% |
| Education Level | |
| No H.S. diploma | 17% |
| H.S. diploma | 39% |
| Some college | 30% |
| College degree | 14% |
| Marital Status | |
| Married | 45% |
| Widowed | 42% |
| Divorced/Separated | 9% |
| Single | 4% |
| Total Number | 106 |
Financial Literacy
Table 2 displays the results of the financial literacy quiz, which consisted of 14 questions, 12 of which were taken from the Jump$tart Coalition's 2008 Personal Financial Literacy Survey Among College and High School Students (Jump$tart Coalition, 2012). The last column contains the corresponding question number on the Jump$tart Survey. Some of these 12 questions were rewritten to reflect scenarios older adults would experience, but the answers to the questions remained the same.
Older adults should have much more experience in dealing with life and health insurance issues, so questions 17 and 26 from the Jump$tart Survey were not used to assess literacy in these two areas. Because older adults are prone to pressure from life insurance salesmen to purchase inappropriate products, they were asked which type of life insurance did not contain a savings component. With regards to health insurance, respondents were asked to select the best definition of a health insurance deductible.
The overall mean score was 62%. Most respondents understood the concepts of inflation, compounding of interest, and a health insurance deductible. Over half were able to perform a simple savings calculation and understood the concept of liquidity. Only half understood the concept of investment growth; over a quarter (27%) confused growth with interest payments. This lack of financial literacy in understanding investments is consistent with Lusardi and Mitchell (2007). While only 51% correctly identified types of auto insurance, older Oklahomans scored better on this question than the national sample of high school and college students that took the 2008 Jump$tart Survey.
| Concept | % Correct | 2008 Jump$tart Survey Question |
| Inflation | 76 | 1 |
| Compounding of interest | 61 | 16 |
| Simple savings calculation | 59 | 10 |
| Liquidity | 54 | 9 |
| Investment growth | 50 | 11 |
| Types of auto insurance | 51 | 22 |
| Health insurance deductible | 76 | |
| Types of life insurance | 51 | |
| Checking your credit history | 76 | 6 |
| Help provided by CCCS | 79 | 15 |
| Lenders access to credit history | 69 | 29 |
| Finance charges | 62 | 28 |
| Risk faced by credit card companies | 76 | 12 |
| Maximum liability if card stolen | 24 | 19 |
While only 51% of respondents correctly answered the life insurance question, 25% did not answer the question. Of those who did answer, 68% were correct. Since "I don't know" was not an available answer, it is assumed that a quarter of survey participants did not know enough about the subject to even guess. This result is consistent with Lusardi and Mitchell (2008). A targeted financial curriculum for this segment of the population should include basic information on life insurance products.
Respondents displayed strong credit card knowledge. Most knew they could receive a free credit report annually and understood the type of help provided by the Consumer Credit Counseling Service. They appeared to understand the risk faced by credit card companies, how much access lenders have to their credit history, and the concept of finance charges. While only about a quarter of respondents knew the maximum liability if their card is stolen is $50, 61% said zero, which reflects current policy by many credit card companies.
Credit Card Usage
Figure 2 displays data regarding credit card usage. The majority has either no or just one major credit card and does not have a non-major credit card. Over the past year, 82% of participants have not missed a payment and 77% have never made a late payment.
Figure 2.
Credit Card Usage
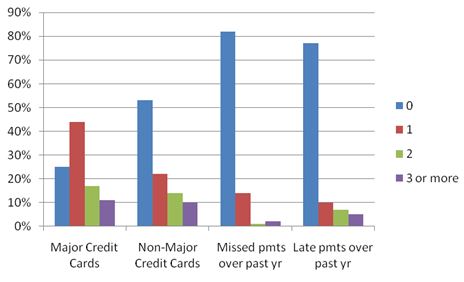
Table 3 contains data on credit card behavior by survey participants. Percentages may not total 100% due to missing data. Those who carry multiple cards do so primarily for everyday purchases. This survey population does not appear susceptible to mail solicitations from credit card companies because only 5% of participants carry multiple cards because they were offered to them.
Over half of participants reported having a credit limit below $10,000. Most (71%) owe less than $10,000 on their credit cards, with 37% reporting a zero balance. The overwhelming majority pay off their balance each month, while only 1% make just the minimum payment. According to Demos (2009), the national average amount of credit card debt held by adults age 65 and older was $10,235 in 2008, up from $8,138 in 2005.
Nationally, older adults age 65 and older reported an average of $3,988 in credit card debt due to medical expenses, the highest amount of any group (Demos, 2009). The older Oklahomans in the research reported much lower credit card use for this purpose. Two-thirds of participants never use their credit cards for medical and dental expenses, while only 13% use them for these expenses on a regular basis. Almost half never use their credit cards for essentials, like food and gas, but almost a third uses them for essentials on a regular basis. When asked how their level of debt has changed over the past 3 years, the results were mixed. Almost the same percentage of respondents increased their level of debt as those who paid down debt, and 40% saw no change in their debt levels.
| Reason for multiple cards | |
| For everyday purchases | 21 |
| To build good credit | 10 |
| To save money | 7 |
| Because they were offered to me | 5 |
| Use for medical expenses | |
| Never | 67 |
| Regularly | 13 |
| Only if above a certain amount | 2 |
| Just a few times | 6 |
| Use for essentials | |
| Never | 46 |
| Regularly | 32 |
| Only if above a certain amount | 5 |
| Just a few times | 9 |
| Pay off balance monthly | |
| Yes | 71 |
| Try to | 10 |
| Minimum + extra | 11 |
| Minimum only | 1 |
| Over the past 3 years, level of debt has | |
| Increased | 24 |
| Decreased | 22 |
| Stayed the same | 40 |
| Credit limit | |
| $0 | 20 |
| <$5,000 | 25 |
| $5,000 - $9,999 | 13 |
| $10,000 - $19,999 | 18 |
| $20,000 - $35,000 | 9 |
| >$35,000 | 8 |
| Outstanding balance | |
| $0 | 37 |
| <$5,000 | 26 |
| $5,000 - $9,999 | 9 |
| $10,000 - $19,999 | 12 |
| $20,000 - $35,000 | 6 |
| >$35,000 | 5 |
Debt Pressures and Well-Being
Table 4 contains data on participants' debt pressures. Overall, those surveyed are not currently experiencing financial distress. Over the past 12 months, only 15% felt they could not cut back on expenses if they had to and only 8% felt they did not have enough money left over at the end of each month. Most felt they were the same or better off this year than they were three years ago.
| At the end of each month | |
| More than enough money left | 31 |
| Some money left over | 32 |
| Just enough to make ends meet | 20 |
| Almost enough to make ends meet | 8 |
| Due to a shortage of money | |
| Pawned/sold something | 3 |
| Went without meals | 0 |
| Foregone medical care | 7 |
| Asked for help | 10 |
| Able to cut expenses | |
| Not at all | 15 |
| A little | 38 |
| Some | 31 |
| Considerably | 16 |
| Afford life expenses | |
| Not at all confident | 12 |
| Somewhat confident | 43 |
| Very confident | 46 |
| Argue with family over money | |
| Seldom/never | 87 |
| Occasionally | 12 |
| All the time | 1 |
| Financial Stress | |
| No stress | 48 |
| A little stress | 43 |
| A lot of stress | 9 |
| Compared to 3 years ago | |
| Better | 30 |
| Same | 47 |
| Worse | 27 |
Those surveyed have never gone without meals because of a shortage of money. Very few have had to pawn/sell something, forgo medical care or medications, or ask for help. The vast majority seldom or never argues with family members over finances and feel little to no stress over their financial situation.
The majority of older Oklahoman survey respondents were happy, healthy, satisfied with life, and enjoy strong social support. Most of the participants reported they were satisfied or very satisfied with their marriages (97%), relationships with other family members (82%), and life in general (85%). When asked questions about the level of social support they receive, most strongly agreed with the following statements.
- I get the emotional help and support I need from my family (64%)
- I can count on my friends when things go wrong (64%)
- I can talk about my problems with my family (67%)
- I have friends with whom I can share my joys and sorrows (73%)
- My family is willing to help me make decisions (62%)
Discussion
Overall, the financial situations and psychosocial well-being for older adults in the research are quite positive, but those with financial pressures face some negative outcomes. Increasing financial literacy and teaching basic budgeting to a targeted segment of older adults have the potential to increase individuals' well-being and their relationships with their family members. Creating partnerships with local community organizations and public advocacy groups that serve the older adult population can help identify those older adults experiencing financial pressures who may benefit from financial education.
The population sample is not representative of all older adults in Oklahoma. Future research can extend these findings to larger, more representative studies including older adults from more urban areas and minority populations. Because the survey results rely on self-reported data, the results likely underestimate credit card usage and debt pressure.
The research can also be extended across different segments of the entire adult population to get a more complete picture of the effect of debt pressures on family and life satisfaction. For example, adults in their fifties and early sixties who are approaching retirement may not have saved enough and thus may have to rely more on credit cards to meet retirement expenses. Adults from the "sandwich generation" currently raising their own families while caring for aging parents already face unique pressures, which may be intensified by the over-reliance on credit cards. The pressures experienced by military families, from military spouses of soldiers facing multiple deployments having to manage family budgets by themselves to returning soldiers who find themselves unemployed, make them especially vulnerable to the overuse of credit cards. This line of research can assist Extension educators in the development and implementation of more effective and holistic debt management programs that can truly benefit families.
References
Center on Aging and Work. (2008). Oklahoma indicators: Aging and work. Retrieved from: http://agingandwork.bc.edu/documents/states/Oklahoma.pdf
Conger, R. D., Conger, K. J., Elder, G. H., Lorenz, F. O., Simons, R. L., & Whitbeck, L. B. (1992). A family process model of economic hardship and adjustment of early adolescent boys. Child Development, 63, 526-541.
Demos. (2009). The plastic safety net. Retrieved from: http://www.demos.org/sites/default/files/publications/PlasticSafetyNet_Demos.pdf
Jump$tart Coalition. (2012). Jump$tart coalition survey of personal financial literacy among students. Retrieved from: http://www.jumpstart.org/survey.html
Lusardi, A., & Mitchell, O. (2007). Financial literacy and retirement preparedness: Evidence and implications for financial education. Business Economics, 42(1), 35-44.
Lusardi, A., & Mitchell, O. (2008). Planning and financial literacy: How do women fare? American Economic Review: Papers and Proceedings 98(2), 413-417.
Lusardi, A., Mitchell, O., & Curto, V. (2009). Financial literacy and financial sophistication in the older population: Evidence from the 2008 HRS. Working Paper 2009-216, University of Michigan Retirement Research Center, Ann Arbor, Michigan.
Miner, Jr., F. D., & Harris, J. L. (1998). PowerPay: Consumer debt reduction software for Extension educators. Journal of Extension [On-line], 36(4) Article 4TOT1. Available at: http://www.joe.org/joe/1998august/tt1.php
Porter, N. M., & Christenbury, J. H. (1999). Money 2000: A model Extension program. Journal of Extension [On-line], 37(1) Article 1FEA1. Available at: http://www.joe.org/joe/1999february/a1.php
Wilde, T. (2011). ReliaBalanceTM: A financial management technique designed to encourage more informed daily financial decisions. Journal of Extension [On-line], 49(4) Article 4TOT6. Available at: http://www.joe.org/joe/2011august/tt6.php