June 2013
|
June 2013 // Volume 51 // Number 3 // Feature // v51-3a1


Using Mixed-Mode Contacts in Client Surveys: Getting More Bang for Your Buck
Abstract
Surveys are commonly used in Extension to identify client needs or evaluate program outcomes. This article examines how available email addresses can be incorporated into mixed-mode procedures for surveys. When mail and email addresses are used to implement a sequence of email and postal invitations in a mixed-mode survey, response rates were somewhat lower than those for mail only surveys. Item nonresponse is, however, lower for questionnaires completed via the Web, and costs for postage were substantially lower for the mixed-mode groups (because 60% of the surveys were completed via the Web). The study demonstrates the benefit of using mixed-mode surveys.
Introduction
Effective and efficient Extension programs are based on accurate information about client assets and needs, while credible accountability reports depend on reliable measurement of outcomes. In both cases, surveys are often used to collect this information. The challenge facing Extension professionals is how to maximize the amount and quality of the data collected while minimizing the cost. Sending survey invitations via email is inexpensive, but this methodology can exclude clients who lack Internet access, and it suffers from comparatively low response rates (Manfreda, Bosnjak, Berelak, Haas, & Vehovar, 2008). Consequently, this approach introduces significant biases in the collected data. This article builds on previous studies (Israel, 2010; 2011) to identify survey strategies that can represent all segments of a program's target audience, encourage a high response rate and answers to all questions on the survey, and keep out-of-pocket printing and postage costs to a minimum.
Background
An earlier study compared three experimental groups. One group, the Web preference group, in which clients received a letter in the mail with the URL and PIN first (because no email addresses were available) and then the paper survey later, had a significantly lower response rate than the second group with the standard mail only method (Israel, 2010). Similarly, the third group, which was offered a choice of responding via the Web or by mail, had a lower response rate than the mail only group. One reason the mail only group had a higher response rate is that this mode puts the survey "in the hand" of the respondent (Holmberg, Lorenc, & Werner, 2010) and accessibility encourages survey completion. An important finding was that differences were found for a number of client demographics and service utilization measures between those responding by mail and on the Web. On the other hand, the combined set of mail and Web responses for the Web preference group and the Web/mail choice group were similar to the traditional mail survey. The same findings have been reported by other researchers for other populations (Lesser, Yang, & Newton, 2011; Messer & Dillman, 2011; Smyth, Dillman, Christian, & O'Neil, 2010).
A follow-up study was conducted to explore the utility of collecting email addresses for use in mixed-mode procedures for delivering survey invitations (Israel, 2011). Three experimental groups of clients who provided both mail and email addresses were compared. An email preference group, which used an email invitation and email reminder after a postal pre-letter, was found to have a higher response rate than the previously described Web preference and mail only groups. However, the small sample size prevented a rigorous test, and the results, while promising, were not significantly different. That exploratory study demonstrated the feasibility of obtaining both mail and email contact information.
Consequently, the purpose of this article is to further examine the feasibility of mixed-mode surveys using email and mail modes to contact clients. Several studies suggest that substantial savings can be achieved over that of mail surveys while obtaining high quality data (Holmberg et al., 2010; Russell, Boggs, Palmer, & Rosenberg, 2010). In addition, the study assessed the strengths and weaknesses of these methods with regard to response rates, similarity of client attributes and answers, and item nonresponse.
Methods
Data collected for the annual survey of Florida Cooperative Extension's (FCES) customers in 2011 were used for the study. The survey was sent to a sample of clients who were selected from the population that had attended a workshop or seminar, called the Extension office, visited the office, or exchanged emails with an agent in order to solicit feedback about their experiences. The survey included questions on: overall customer satisfaction with the services provided by Extension, clientele's satisfaction on four dimensions of quality, outcomes of the use of Extension service, and demographic attributes of the respondents. The customer satisfaction survey has been conducted annually since 1997 using telephone (1997-2004), mail (2003-2011), Web-hosted, and mixed-modes (2008-2011) (Israel, 2010; Israel, 2011; Israel & Lamm, 2012). As with previous studies, the data were collected after the protocol was approved by the institutional review board at the University of Florida.
For the 2011 survey, a random sample of 1,939 was selected from lists of Extension clients in 11 of Florida's 67 counties. The list of clients was obtained from registration lists of scheduled educational programs, as well as sign-in sheets at county Extension offices, phone logs, and email logs from each member of the professional staff during a 30-day period. Selected clients were sorted into three strata: those providing both an email address and a postal address, those providing a postal address only, and those providing an email address only. Clients in the first strata (providing both an email and postal address), were randomly assigned to three experimental groups:
- Mail only: Postal invitations with paper questionnaires only (n = 306).
- Email preference: After sending a postal pre-letter, the request to complete the survey and subsequent reminder were sent via email. The final contact switched modes to a postal follow-up (n = 307).
- Email with final mail questionnaire: The first three contacts were sent by email. The final contact switched modes to a postal follow-up (n = 305).
The second and third strata, clients who provided only a postal address or only an email address, respectively, were designated as groups 5, Mail only (n = 521), and 6, Email only (n = 500). Thus, comparisons among the groups within the first strata are experimental, while all other comparisons reflect selection processes that affect the collection of postal and email addresses.
The mail and Internet surveys were constructed to follow Dillman et al.'s (2009) unified mode design principles. These principles included using the same questions and question order and, more important, working to minimize differences in visual design (as illustrated in Israel, 2010). The two-page mail questionnaire had 21 items and utilized gray shading to distinguish blocks of related questions. Similarly, the Internet survey presented questions in groups or singly on a separate screen (Israel, 2010).
The Web survey used Qualtrics survey software. Clients who had received the invitation via email could click on the link to access the URL and then enter the personal identification number (PIN). Upon entry, the informed consent information was presented. When the "Agree to participate" button was selected, the screen containing the initial questions was presented.
The invitation letters and reminders were constructed to provide the same verbal and visual presentation to clients. A series of contacts were used to implement the survey, as shown in Table 1. Some clients in groups 2 and 3 did not receive the email invitation and were excluded from the results reported below.
| Contact information available | |||||
| Postal and email address | Postal only | Email only | |||
| 1. Postal only | 2. Email preference | 3. Email with final mail | 4. Postal only | 5. Email only | |
| 1st contact | Mail pre-letter | Mail pre-letter | Email invitation with link | Mailpre-letter | Email invitation with link |
| 2nd contact | Mail letter & questionnaire | Email invitation with link | Email invitation with link | Mail letter & questionnaire | Email invitation with link |
| 3rd contact | Mail post card | Email invitation with link | Email invitation with link | Mail post card | Email invitation with link |
| 4th contact | Mail letter & questionnaire | Mail letter & questionnaire | Mail letter & questionnaire | Mail letter & questionnaire | Email invitation with link |
Data were analyzed using SAS for Windows, version 9.3 (SAS Institute Inc.). The z statistic was used to test for differences between proportions, while the Chi-square test for independence was used for differences in demographic attributes, use of Extension, and satisfaction/outcomes by treatment for categorical and ordinal variables. Analysis of variance was used to test for differences for interval variables by treatment group.
Findings
How Does Using Email Impact Clients Receiving the Survey?
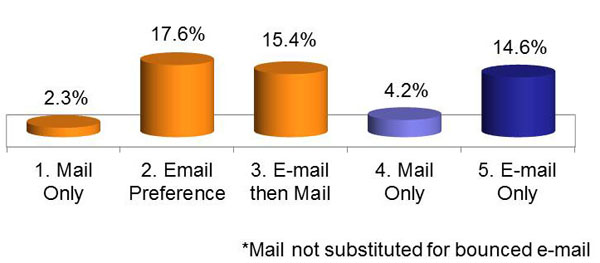
Using email reduces the number of clients who receive the invitation to answer the questionnaire. Between 14.6% and 17.6% of clients' email addresses failed to work (Figure 1). Undeliverable emails might have resulted from incorrectly deciphering clients' writing or typing them into the contact database, or becoming obsolete as clients changed email service providers between collecting the contact data and initiating the survey. Fewer postal addresses were undeliverable, between 1.3% and 4.2%. For mixed-mode surveys, a mail questionnaire can quickly be substituted when an email "bounces."
Figure 1.
Unreachable Rate by Contact Mode
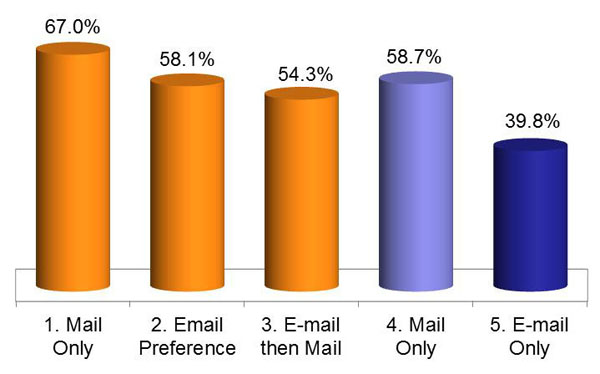
Are Response Rates for Mixed-Mode Groups Equal to That of Mail Only?
Comparison of the final response rate for the experimental groups in Figure 2 shows that the two mixed-mode treatments (groups 2 and 3) had statistically equal response rates (z23 = .513, p = .608). The two mixed-mode groups also had significantly lower response rates than the mail only treatment (group 1; z21 = 2.060, p = .039 and z31 = 2.598, p = .009, respectively). Clients who provided only a postal address (group 4) had a response rate similar to the two mixed-mode groups, while those who provided only an email address (group 5) had the lowest response rate.
Figure 2.
Total Response Rate by Treatment Group
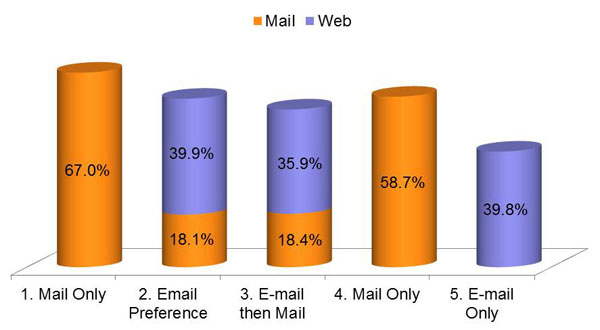
It is noteworthy that the final contact for both Groups 2 and 3 resulted in a substantial number of mail surveys (over 18%, Figure 3). This suggests that many clients who have access to the Internet continue to prefer paper-and-pencil surveys delivered via the mail.
Figure 3.
Response Rate by Treatment Group and Response Mode
Are Responses Different Between Experimental Groups?
Analysis revealed differences between the three experimental groups (for the strata comprised of clients providing mail and email addresses) on educational attainment and the number of CES contacts. The email then mail treatment (Group 3) had more respondents with some college and fewer with a college degree than the other two treatment groups (Table 2). On the other hand, respondents in the email preference treatment (Group 2) had a higher number of contacts during the past year than did respondents in the other treatments. Responses to substantive items concerning customer satisfaction did not differ significantly between the three treatments. Despite the differences noted above, there was no clear pattern distinguishing the responses of the three groups.
| 1. Mail only | 2. Email preference | 3. Email then mail | Test for significance between treatments | |
| Demographic items | ||||
| Age (mean) |
n = 188 |
n = 137 |
n = 127 |
F =.78 df=2 p=.460 |
| 58.3 | 56.7 | 58.4 | ||
| Sex | n = 197 | n = 147 | n = 139 |
x2 = 1.477 df = 2 p = .478 |
| Female (%) | 61.4 | 58.5 | 65.5 | |
| Educational attainment (%) | n = 196 | n = 142 | n = 133 |
x2 = 17.283 df = 8 p = .027 |
| Some high school or less | 1.0 | .7 | .8 | |
| High school graduate or GED | 12.8 | 7.7 | 15.0 | |
| Some college | 38.8 | 37.3 | 51.1 | |
| College bachelor's degree | 29.6 | 32.4 | 15.0 | |
| Post graduate degree | 17.9 | 21.8 | 18.0 | |
| Place of residence (%) | n = 196 | n = 141 | n = 135 |
x2 = 1.183 df = 4 p = .881 |
| Farm | 10.7 | 11.3 | 13.3 | |
| Rural, non-farm | 27.0 | 30.5 | 26.7 | |
| Urban | 62.2 | 58.2 | 60.0 | |
| Use of CES services items | ||||
| Number of years (mean) | n = 177 | n = 135 | n = 127 |
F = .17 df = 2 p = .841 |
| 8.7 | 9.4 | 9.0 | ||
| Number of contacts last year (mean) | n = 180 | n = 139 | n = 125 |
F = 4.05 df = 2 p = .018 |
| 5.8 | 9.2 | 5.7 | ||
| Visited Solutions for your life Web portal (%) | n = 197 | n = 141 | n = 135 |
x2 = 12.127 df = 8 p = .146 |
| Campus Website | 9.1 | 10.6 | 8.9 | |
| County Website | 22.3 | 16.2 | 19.3 | |
| Both Websites | 10.7 | 14.1 | 6.7 | |
| No | 55.8 | 56.3 | 57.8 | |
| Don't know | 2.0 | 2.8 | 7.4 | |
| Satisfaction and outcome items | ||||
| Information accuracy (%) | n = 199 | n = 147 | n = 138 |
x2 = 4.092 df = 6 p = .664 |
| Very dissatisfied/Dissatisfieda | 1.5 | 2.0 | .0 | |
| No opinion | 1.5 | 2.7 | 1.4 | |
| Satisfied | 21.6 | 23.1 | 24.6 | |
| Very satisfied | 75.4 | 72.1 | 73.9 | |
| Timely delivery (%) | n = 199 | n = 147 | n = 138 |
x2 = 6.603 df = 6 p = .359 |
| Very dissatisfied/Dissatisfieda | 2.0 | 2.8 | .0 | |
| No opinion | 3.0 | 2.0 | 1.4 | |
| Satisfied | 20.6 | 26.5 | 30.4 | |
| Very satisfied | 74.4 | 68.7 | 68.1 | |
| Information relevance (%) | n = 199 | n = 147 | n = 137 |
x2 = 7.453 df = 6 p = .281 |
| Very dissatisfied/Dissatisfieda | 2.0 | 2.1 | .7 | |
| No opinion | 5.5 | 6.1 | 2.9 | |
| Satisfied | 21.1 | 29.6 | 32.1 | |
| Very satisfied | 71.4 | 62.6 | 64.2 | |
| Easy to understand (%) | n = 199 | n = 145 | n = 138 |
x2 = 6.484 df = 6 p = .371 |
| Very dissatisfied/Dissatisfieda | 2.0 | 2.8 | .0 | |
| No opinion | 2.5 | 2.8 | 1.4 | |
| Satisfied | 20.6 | 25.5 | 30.4 | |
| Very satisfied | 74.9 | 69.0 | 68.1 | |
| Shared information with another person (%) | n = 194 | n = 142 | n = 134 |
x2 = 1.202 df = 4 p = .878 |
| Yes | 78.4 | 77.5 | 76.9 | |
| No | 20.1 | 21.1 | 20.1 | |
| Don't know | 1.5 | 1.4 | 3.0 | |
| Overall satisfaction (%) | n = 198 | n = 140 | n = 135 |
x2 = 6.218 df = 6 p = .399 |
| Very dissatisfied/Dissatisfieda | .5 | 1.4 | .0 | |
| No opinion | 3.0 | .7 | 1.5 | |
| Satisfied | 21.2 | 21.4 | 26.7 | |
| Very satisfied | 75.3 | 76.4 | 71.9 | |
| a The responses categories were combined in calculating the Chi-square statistic. | ||||
Do Clients Who Provide Email and Postal Addresses Differ from Those Who Provide a Singular Contact Mode?
Additional analysis showed that there were numerous differences between the three strata of extension clients (based on clients with both mail and email contact information (Groups 1-3), mail only (Group 4), and email only (Group 5)). Comparisons of the three strata can be found in Table 3. One key difference was that clients in the mail only stratum had a significantly higher average age, had a higher percentage with a high school diploma or less education, and were less likely to live in an urban area than were the other two strata. Additionally, a majority of responding clients in the email only stratum were male, while more females responded in the other two strata. Because of the age difference, the mail only stratum had the highest average number of years using Extension's services, and this stratum was much less likely to have sought information through the Web portal.
Finally, respondents in the mail only stratum were significantly less likely to rate their overall satisfaction as "very satisfied" and share information with other persons in comparison to those in the other two strata. Although not statistically significant at the a priori .05 level, those in the mail only stratum also showed a pattern of a lower percentage with a very satisfied rating ranging from 59.6% to 65.6% for the four service quality items (information accuracy, relevance, timely delivery, and easy understanding) than the other two strata, ranging from 64.5% to 75.3%.
| Mail and email | Mail only | Email only | Test for significance between strata | |
| Demographic items | ||||
| Age (mean) |
n = 483 |
n = 259 |
n = 180 |
F =33.69 df=2 p<.001 |
| 58.2 | 63.9 | 53.9 | ||
| Sex | n = 497 | n = 267 | n = 164 |
x2 = 12.947 df = 2 p = .002 |
| Female (%) | 61.2 | 51.7 | 47.1 | |
| Educational attainment (%) | n = 502 | n = 269 | n = 186 |
x2 = 43.361 df = 8 p < .001 |
| Some high school or less | .8 | 2.6 | .0 | |
| High school graduate or GED | 11.2 | 22.7 | 8.1 | |
| Some college | 42.0 | 39.4 | 41.4 | |
| College bachelor's degree | 26.5 | 19.3 | 35.5 | |
| Post graduate degree | 19.5 | 16.0 | 15.1 | |
| Place of residence (%) | n = 503 | n = 275 | n = 188 |
x2 = 14.073 df = 4 p = .007 |
| Farm | 11.3 | 14.5 | 8.0 | |
| Rural, non-farm | 27.6 | 29.1 | 19.1 | |
| Urban | 61.1 | 56.4 | 72.9 | |
| Use of CES services items | ||||
| Number of years (mean) | n = 464 | n = 210 | n = 182 |
F = 2.81 df = 2 p <.001 |
| 8.8 | 10.7 | 10.6 | ||
| Number of contacts last year (mean) | n = 473 | n = 230 | n = 184 |
F = 13.28 df = 2 p <.001 |
| 6.7 | 3.1 | 4.4 | ||
| Visited Solutions for your life Web portal (%) | n = 505 | n = 268 | n = 188 |
x2 = 56.207 df = 8 p <.001 |
| Campus Website | 9.7 | 5.2 | 7.4 | |
| County Website | 19.2 | 10.1 | 19.1 | |
| Both Websites | 10.3 | 3.4 | 16.0 | |
| No | 56.8 | 79.9 | 52.7 | |
| Don't know | 4.0 | 1.5 | 4.8 | |
| Satisfaction and outcome items | ||||
| Information accuracy (%) | n = 518 | n = 285 | n = 197 |
x2 = 11.648 df = 6 p = .070 |
| Very dissatisfied/Dissatisfieda | .6 | .0 | .5 | |
| No opinion | 2.1 | 3.9 | 3.6 | |
| Satisfied | 22.0 | 30.5 | 25.4 | |
| Very satisfied | 75.3 | 65.6 | 70.6 | |
| Timely delivery (%) | n = 517 | n = 288 | n = 197 |
x2 = 11.471 df = 6 p = .075 |
| Very dissatisfied/Dissatisfieda | 1.4 | 1.7 | .0 | |
| No opinion | 2.1 | 2.1 | 4.6 | |
| Satisfied | 24.2 | 30.6 | 28.9 | |
| Very satisfied | 72.3 | 65.6 | 66.5 | |
| Information relevance (%) | n = 516 | n = 285 | n = 107 |
x2 = 9.004 df = 6 p = .173 |
| Very dissatisfied/Dissatisfieda | 1.4 | 2.1 | 1.5 | |
| No opinion | 4.8 | 3.5 | 3.0 | |
| Satisfied | 26.0 | 34.7 | 31.0 | |
| Very satisfied | 67.8 | 59.6 | 64.5 | |
| Easy to understand (%) | n = 515 | n = 284 | n = 196 |
x2 = 12.141 df = 6 p = .059 |
| Very dissatisfied/Dissatisfieda | 1.0 | 1.8 | 1.5 | |
| No opinion | 2.5 | 2.5 | 3.1 | |
| Satisfied | 24.3 | 34.2 | 23.5 | |
| Very satisfied | 72.2 | 61.6 | 71.9 | |
| Shared information with another person (%) | n = 503 | n = 281 | n = 186 |
x2 = 17.640 df = 4 p = .002 |
| Yes | 77.9 | 66.2 | 78.0 | |
| No | 20.3 | 32.4 | 19.4 | |
| Don't know | 1.8 | 1.4 | 2.7 | |
| Overall satisfaction (%) | n = 507 | n = 287 | n = 190 |
x2 = 17.110 df = 6 p = .009 |
| Very dissatisfied/Dissatisfieda | .8 | 2.4 | .0 | |
| No opinion | 2.0 | 4.5 | 3.2 | |
| Satisfied | 22.7 | 28.9 | 23.7 | |
| Very satisfied | 74.6 | 64.1 | 73.2 | |
| a The responses categories were combined in calculating the Chi-square statistic. | ||||
Does the Emailed Invitation Result in Reduced Costs?
In terms of the postage cost using first class mail, the email then mail (Group 3) treatment was the least expensive ($.65 per completed survey), followed by the email preference (Group 2) treatment ($1.37), and finally the mail only (Group 1) treatment ($2.58) for clients who provided both postal and email addresses. The mail only treatment for clients without email addresses was the most expensive ($2.94 per completed survey), while clients who provided only their email address had no postage cost per return. In short, using email invitations in mixed-mode surveys can reduce postage costs as compared to mail only surveys.
How Does the Quality of Data Differ Between Surveys Completed by Web and Mail?
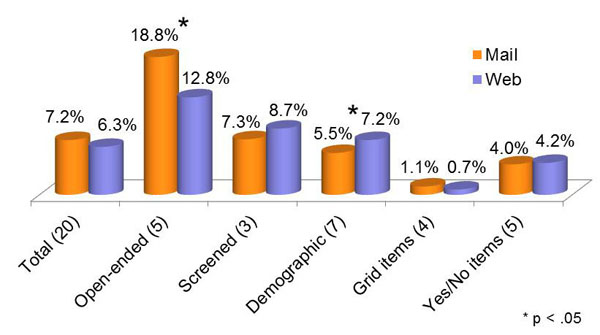
Item nonresponse is used as a measure of data quality (Israel & Lamm, 2012). Of the questionnaires completed on the Web, 57.1% had answers for every item, while 39.5% of paper questionnaires (returned by mail) were completely answered. Overall, Web surveys had a lower item nonresponse rate than did mail surveys (6.3% and 7.2%, respectively, Figure 4), but item nonresponse differed for some question types. Item nonresponse was higher on open-ended question for the mail mode than for the Web mode. In comparison, the mail mode had a lower item nonresponse for the demographic questions than did the Web mode. Differences on other types of questions (grid items, yes/no/don't know) and screened questions were not statistically significant.
Figure 4.
Item Nonresponse Rate by Question Type and Response Mode (number of items in parentheses).
Conclusions and Discussion
When conducting a needs assessment survey or follow-up survey to evaluate a program, Extension professionals should consider their options. This article reaffirmed the results from previous studies that mail surveys typically have higher responses rates (Israel, 2010; 2011; Manfreda et al., 2008; Smyth et al. 2010). Because mail surveys continue to generate high response rates and, as seen above, have limited item nonresponse, they can be very effective when the funds are available to cover postage and printing costs.
Mixed-mode surveys using available email addresses were also found to provide substantively similar information at a lower cost. This finding was especially true for the email then mail strategy. It is also clear that from the study reported here, as well as earlier ones (Israel, 2010; 2011), that using only email results in lower response rates and introduces bias in the data. This bias occurs because people who do not have email and those who prefer paper surveys will not respond to the email request and these groups have different characteristics from those who do complete surveys via email and the Web.
In addition, the results for the data quality analysis were mixed. Web responses were more complete and item non-response was lower for open-ended questions than for surveys completed on the paper forms. Item nonresponse on the demographic items was, however, lower for paper surveys. Overall, item nonresponse is a smaller problem for surveys completed on the Web than using paper forms. This finding was consistent with other recent studies (Israel & Lamm, 2012; Lesser, Newton, & Yang, 2012; Messer, Edwards, & Dillman, 2012).
Recommendations
- Extension professional should use one of the mixed-mode strategies when postal and email addresses are available.
- When there are clients who have only a postal address, the survey should also include a mail only stratum (in addition to the mixed-mode strategy) because this group tends to differ from those with Internet access (Israel, 2010; Smyth et al., 2010).
- Extension professionals should avoid using an email only methodology because the data are likely to be biased more than other strategies.
- Extension professional should emphasize mixed-mode methods for collecting Web responses when it is important to get answers to open-ended questions.
Acknowledgments
This research is part of Florida Agricultural Extension Station project FLA-AEC-004832.
References
Dillman, D. A., Smyth, J. D., & Christian, L. M. (2009). Internet, mail, and mixed-mode surveys: The tailored design method. (3rd ed.). Hoboken, NJ: John Wiley and Sons.
Holmberg, A., Lorenc, B., & Werner, P. (2010). Contact strategies to improve participation via the Web in a mixed-mode mail and Web survey. Journal of Official Statistics, 26(3), 465-480.
Israel, G. D. (2010). Using Web-hosted surveys to obtain responses from Extension clients: A cautionary tale. Journal of Extension [On-line], 48(4), Article 4FEA8. Available at: http://www.joe.org/joe/2010august/a8.php
Israel, G. D. (2011). Strategies for obtaining survey responses from Extension clients: Exploring the role of email requests. Journal of Extension [On-line], 49(2), Article 3FEA7. Available at: http://www.joe.org/joe/2011june/a7.php
Israel, G. D., & Lamm, A. J. (2012). Item non-response in a client survey of the general public. Survey Practice, April. Retrieved from: http://surveypractice.wordpress.com/2012/04/17/item-nonresponse-in-a-client-survey-of-the-general-public/#more-6070
Lesser, V. M., Yang, D. K., & Newton, L. D. (2011). Assessing hunters' opinions based on a mail and a mixed-mode survey. Human Dimensions of Wildlife, 16, 164-173. doi: 10.1080/10871209.2011.542554
Lesser, V. M., Newton, L. A., & Yang, D. (2012). Comparing item nonresponse across different delivery modes in general population surveys. Survey Practice, April. Retrieved from: http://surveypractice.wordpress.com/2012/04/17/comparing-item-nonresponse-across-different-delivery-modes-in-general-population-surveys-2/#more-6026
Manfreda, K. L., Bosnjak, M., Berelak, J., Haas, I., & Vehovar, V. (2008). Web surveys versus other survey modes: A meta-analysis comparing response rates. International Journal of Market Research, 50(1), 79-104.
Messer, B. L., & Dillman, D. A. (2011). Using address-based sampling to survey the general public by mail vs. Web plus mail. Public Opinion Quarterly, 75(3), 429-457. doi: 10.1093/poq/nfr021
Messer, B. L., Edwards, M. L., & Dillman, D. A. (2012). Determinants of item nonresponse to web and mail respondents in three address-based mixed-mode surveys of the general public. Survey Practice, April. Retrieved from: http://surveypractice.wordpress.com/2012/04/17/determinants-of-item-nonresponse-to-web-and-mail-respondents-in-three-address-based-mixed-mode-surveys-of-the-general-public/#more-5998
Russell, C. W., Boggs, D. A., Palmer, J. R., & Rosenberg, L. (2010). Use of a Web-based questionnaire in the Black Women's Health Study. Practice of Epidemiology, 172(11), 1286-1291. doi: 10.1093/aje/kwq310
Smyth, J. D., Dillman, D. A., Christian, L. M., & O'Neill, A. (2010). Using the Internet to survey small towns and communities: Limitations and possibilities in the early 21st century. American Behavioral Scientist, 53(9), 1423-1448. doi: 10.1177/0002764210361695