February 2013
|
February 2013 // Volume 51 // Number 1 // Tools of the Trade // v51-1tt3


Database Application for a Youth Market Livestock Production Education Program
Abstract
This article offers an example of a database designed to support teaching animal production and husbandry skills in county youth livestock programs. The system was used to manage production goals, animal growth and carcass data, photos and other imagery, and participant records. These were used to produce a variety of customized reports to help guide leaders and members through the project animal selection and management process and evaluate progress over time. The chief advantage of the system is in its utility in reducing the effort required to perform the many communication and information-sharing tasks that were necessary for success.
Introduction
Many youth livestock programs have adopted ultrasound measurement of fat and muscle characteristics in market project animals to bring more elements of commercial food animal selection, production, and care into livestock exhibitions (Nash, 2007). Agricultural education programs vary in how they use this information, and many could likely make more effective use of it than they presently do.
Shurson and Lattner (1991) offered evidence that more focus on biology and animal care skills in 4-H livestock projects is needed. This may still be true in many places. When integrated by an educational strategy, this information can help improve the market quality of animals exhibited at youth shows (Nash, 2007). Carol Smith (2009) described how good management software can reduce the labor required to accomplish tasks, reduce the amount of prep time required, and increase accuracy.
That can be extended to educational outreach as well. Williams and Raper's (2011) example of a Microsoft (MS) Excel application for automatically organizing and disseminating information is a good one. While Excel is more familiar to most users and can emulate some database functions, a dedicated database system can offer substantial advantages as the processing and distribution of data becomes more complex.
Background
Main elements of the application described here were originally developed during the course of a pilot youth livestock education project conducted in El Paso County, Colorado, in 1997-1999 for the Colorado State University 4-H Youth Development Program. The goal was to improve how animal husbandry and production skills were taught to 4-H food animal project members. Much of this was inspired by Gene and Chad Gibson (UI Cooperative Extension) and their livestock "Systems Approach" youth education and animal evaluation program. Measurable animal production "targets" were established for the market animal projects and reinforced through the evaluation of these in animals at the fair exhibition. Leaders and members were provided these targets before purchasing their animals and provided guidelines to aid them in choosing appropriate animals. They were given additional feedback about their animals at a pre-fair weigh-in and a final evaluation at the exhibition itself. A MS Access database was developed to handle the increase in communication between the Extension office, project leaders, and members/parents. The database has continued its development in California and continues to evolve.
Database Design
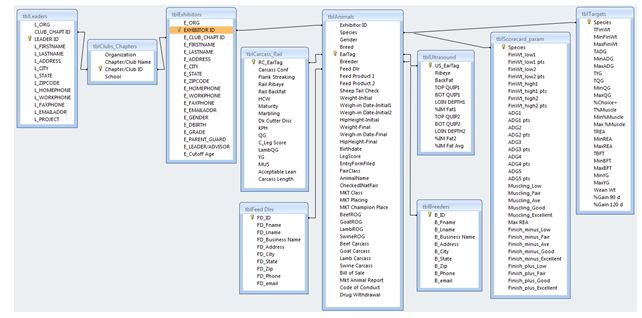
Figure 1 shows the data tables and how they are connected through "key" fields to pull information from each other. Nearly any detail can be obtained for an exhibitor or their animal(s), given an exhibitor ID or animal ear tag #. This educational focus was on the "Targets" table, which contained the production goals for each market animal species (Table 1).
Figure 1.
Table Relationships View in MS Access
| Initial Wt (lbs) | Final Wt (lbs) | ADG (lbs/d) | YG (units) | |||||
| Species | Target | Actual | Target | Actual | Target | Actual | Target | Actual |
| Goat | 69 | 59 | 100 | 82 | 0.4 | 0.4 | 1.5 | 1.4 |
| Sheep | 84 | 90 | 135 | 123 | 0.7 | 0.5 | 2.0 | 2.4 |
| Swine | 144 | 153 | 250 | 240 | 1.7 | 1.4 | ||
| Beef | 748 | 896 | 1,200 | 1,222 | 2.9 | 1.9 | 2.5 | 2.7 |
| %Choice | REA (in2) | FT (in) | %Muscle | |||||
| Species | Target | Actual | Target | Actual | Target | Actual | Target | Actual |
| Goat | 2.0 | 2.4 | 0.10 | 0.10 | ||||
| Sheep | 2.0 | 3.4 | 0.30 | 0.20 | ||||
| Swine | 7.0 | 6.4 | 0.60 | 0.50 | 55.3% | 40.8% | ||
| Beef | 75.0% | 69.6% | 12.0 | 12.8 | 0.50 | 0.40 | ||
Reports produced from this information include:
- Animal production targets and results (Table 1, Figure 2)
- Pre-weigh reports for exhibitors (Figure 3) and leaders
- Datasheets pre-printed with animal IDs, exhibitor names/club membership for weigh-in and scanning at the fair
- Entries ranked by weight for superintendents to use in breaking classes, and then detailed class lists
- Scorecards, pre-organized by classes, for judges when scorecard shows are being run; these include breed, gain and scan data printed on each animal's card
- Class by class animal data for audiences to view during market shows
- Carcass and rate-of-gain contest results
- Final reports to exhibitors and leaders, displaying individual animal data and images with production targets, accompanied by tabular representations of county and club/chapter performance levels
- Performance results to breeders and feed dealers on how their animals, or animals fed their products, compared to others in the exhibition
Figure 2.
Example Portion of Animal Purchase Weight Guidelines Report. Generated on the Basis of Weigh-In Dates and Fair Market Weight Rules. Distributed to All Leaders Before Project Animals Are Purchased.
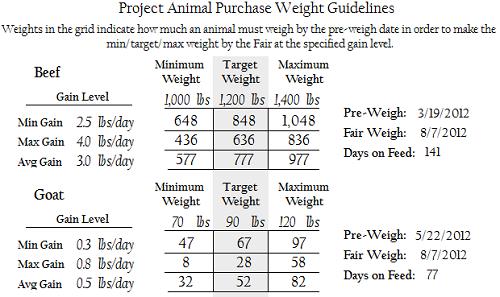
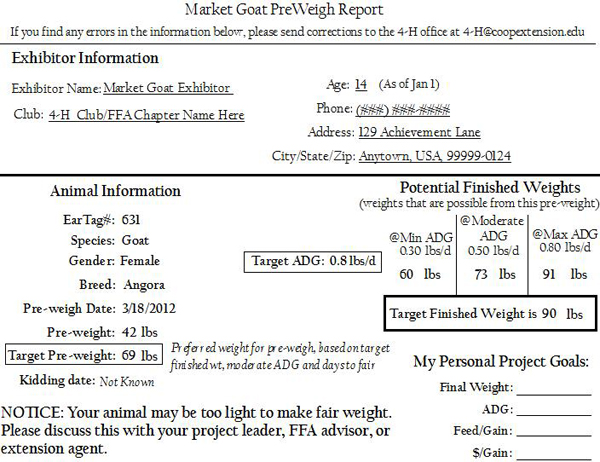
Figure 3.
Example Portion of a Pre-Weigh Report as Generated from the Database. Includes Exhibitor and Animal Information for Verification Purposes, and a Warning for Animals That Are Outside the Prescribed Weight Range.
The chief value of the database is that it can accomplish most of these things with minimal intervention, aside from data entry. Early on, the simple ability to automatically generate organized club report "packets" for mailing substantially relieved staff effort in accomplishing new chores added by the program (sending pre-weigh reports to exhibitors, for example). With the latest versions of Access, it is possible to have the system e-mail reports to members and leaders automatically. These kinds of processes can lessen staff effort for routine tasks, and reduce workload sufficiently to follow through on other objectives.
This database has also been used to store animal profile and hindquarters photos, ultrasound scans, and carcass (ribeye) photos for inclusion in the exhibitors' final individual reports. When photos are taken of animals at both the pre-fair and fair weigh-ins and carcass data is collected, animals of differing ribeye area or fat thickness can be searched for, and their appearance as both feeder and market animals can be displayed. These images have been helpful in teaching visual evaluation skills, especially of feeder animals. Use of photos is best undertaken with the assistance of someone familiar with the nuances of Access' image handling procedures, however.
Each year's data can be uploaded to an archival database, which can generate reports on trends in performance measures over time for each species at the county, club, or individual exhibitor level. This aids in discovering rates and magnitudes of change at each level of organization, and refining outreach.
In addition to carcass and growth traits, such systems can be expanded to evaluate other dimensions of livestock projects, including enterprise budgets, veterinary care, and nutrition.
Conclusion
While individual tasks that made up this program can all quite readily be accomplished without a comprehensive management system, tying them all together in a coherent and efficient way requires one. The many related tasks that were automated together in this case would have exceeded the time and energy of Extension staff and volunteers without it. A chief weakness of current database applications is that they do require some skill to design properly and manage. Successful implementation depends on the persistent availability of people with those skills. Where staff or volunteers are capable of designing even basic database applications, however, such investments can help shift time and creative energy back into pushing outreach and education efforts forward.
References
Nash, S. (2007). Ultrasound technology helps youth raise industry-acceptable market animals. Journal of Extension [On-line], 45(4) Article 4RIB4. Available at: http://www.joe.org/joe/2007august/rb4.php
Shurson, J. C., & Lattner, C. L. (1991). Beyond livestock contests. Journal of Extension [On-line], 29(4) Article 4RIB5. Available at: http://www.joe.org/joe/1991winter/rb5.php
Smith, C. A. (2009). De-stress your county fair—Let technology do the work! Journal of Extension [On-line], 47(5) Article 5TOT5. Available at: http://www.joe.org/joe/2009october/tt5.php
Williams, G.S., & Raper, K.C. (2011). An automated data analysis tool for livestock market data. Journal of Extension [On-line], 49(6) Article 6TOT7. Available at: http://www.joe.org/joe/2011december/tt7.php