February 2013
|
February 2013 // Volume 51 // Number 1 // Research In Brief // v51-1rb7


Current and Future Water Availability: Public Opinion in the Southern United States
Abstract
We examine public opinions about future water availability using results of a survey conducted in 2008 – 2010 in nine southern states. Because a large percentage of respondents in Florida, Georgia, and Texas were concerned with water availability, and many in Tennessee believed a prolonged drought was likely, residents of these states may be more responsive to water conservation educational programs. To increase public awareness about water issues, Extension should tailor educational programs to new state residents and those with lower educational levels. Extension programs focusing on global warming impacts on water resources can have high effects in Arkansas and Oklahoma.
Introduction
Measures of public opinion about current and future water availability provide a tool for tailoring water resource Extension programs to the needs of specific audiences (Mahler et al., 2010; Prokopy, Molloy, Thompson, & Emmert, 2010). We examine public opinions about current and future water quantity problems and the likelihood of prolonged drought in nine southern U.S. states. The results of this article can be used to develop water resource educational programs targeting specific socio-demographic groups.
Materials and Methods
A mail public survey of water-related attitudes and behaviors was implemented in nine southern U.S. states (Table 1). The survey instrument was based on a template developed in the Pacific Northwest (Mahler, Simmons, Sorensen, & Miner, 2004) and included approximately 60 questions to gauge opinions about a water resource issues based on socio-economic and demographic information. Target sample size for each state was based on state population, with an error margin of no more than 4% (given the targeted 45% response rate, Dillman, 2007). A random sample of mailing addresses (balanced for equal representation of males and females) was purchased from Survey Sampling International (Fairfield, Connecticut). Over an approximately 10-week period, each individual in the sample received two copies of the survey (with a pre-paid return envelope) and two reminder post-cards. Survey responses were coded and analyzed using SAS 9.2 Statistical Software (SAS Institute, Inc., 2008).
| State | 2008 Adult Population, million* | Year Survey Was Administered | Sample Size | Survey Response Rate (%) |
| Alabama (AL) | 3.5 | 2009 | 610 | 48% |
| Arkansas (AR) | 2.2 | 2008 | 425 | 60% |
| Florida (FL) | 14.3 | 2008-2009 | 1150 | 45% |
| Georgia (GA) | 7.1 | 2010 | 1100 | 47% |
| Louisiana (LA) | 3.3 | 2008 | 600 | 42% |
| Mississippi (MS) | 2.2 | 2009 | 440 | 65% |
| Oklahoma (OK) | 2.7 | 2008 | 512 | 52% |
| Tennessee (TN) | 4.7 | 2008 | 700 | 50% |
| Texas (TX) | 17.6 | 2008 | 1275 | 33% |
| Overall | 57.6 | 6202 | 51% | |
|
Sources: US Census (2009 a,b,c,d,e,f,g,h,i) |
||||
In this article, we summarize responses to four survey questions about current and future water availability (Table 2). Our goals are to gauge the overall level of public concern about water availability and to identify groups of residents most likely to have insufficient information about water resources. To achieve these goals, alternative answer choice frequencies were examined using Proc Freq (SAS Institute, Inc., 2008). In addition, logistic regression was used to analyze factors affecting the likelihood of selecting specific responses (Proc Logistic). Logistic regression is a standard way to examine binary and discrete dependent variables (Kenney, 2008). Factors considered were (a) socio-demographics, (b) environmental ideologies, (c) opinions on performance of individuals and government agencies in protecting water resources, and (d) Extension as a source of water resource information.
|
A. Do you regard water quantity (having enough water) as a problem in the area where you live? (Circle one answer)
|
B. The likelihood of your area having enough water resources to meet all of its needs 10 years from now is:
|
C. The likelihood of your area suffering from a prolonged drought is:
|
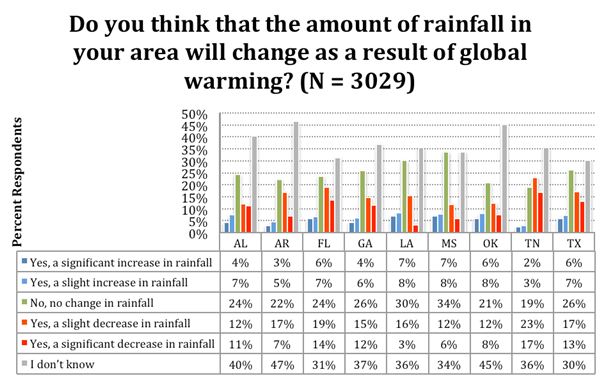
D. Do you think that the amount of rainfall in your area will change as a result of global warming?
|
Results
Survey response exceeded the desired 45% return in most states (Table 1), but the demographics differed from that expected for the general population. According to the US Census, 40% are in the 25-44 age group (US Census, 2010), compared to 21% in the survey reported here. Likewise, our respondents were 31% female, compared to 51% reported in US Census. Only 20% of respondents had less than a high school education, and 22% had advanced degrees, showing a higher educational level than the average. Hence, our respondents were older, better educated, and more likely to be male than the general U.S. population.
Logistic regression analysis shows that the level of concern about water resources depends on respondents' place of residence, educational level, age, gender, environmental protection values/ideology, opinions on performance of individuals and governments in protecting water resources, and having Extension as a source of water resource information, as discussed below.
Residence
Respondents from Alabama, Arkansas, Louisiana, and Mississippi were relatively unconcerned about current and future water availability in their areas (Figures 1 & 2). Possible explanations for this result include low levels of drought in these states near the time of survey (AL in August 2009, AR in July 2008, LA in August 2008, and MS in July 2009), as well as their shared border along the lower Mississippi River—an abundant source of freshwater supply (except AL). In contrast, 40%-50% from Florida and Georgia considered water quantity to be a problem in their areas, along with the low likelihood of their areas meeting all their future water needs. A shared characteristic of these two states is high water demand due to rapid population growth. State agencies in Florida (FDEP, 2010) and (Georgia Water Council, 2008) have publicly stressed the need for water conservation and alternative water supply development. Very severe drought conditions and local water shortages in Georgia during 2007-2008 (Water Council 2008) may have also contributed to the results observed for this state.
Approximately half of Texas respondents considered water quantity to be a problem and the likelihood of prolonged drought to be increasing (Figure 3). Central and southern Texas experienced severe drought conditions in August 2008 (US Drought Monitor, 2011) at the time the survey was given. However, the fact that 62% of Texas respondents believed that the likelihood of their areas meeting all their water needs in 10 years is high or medium suggests that they believe that their water quantity problems can be resolved in the future (e.g., through more efficient water use and policies). Tennessee respondents were relatively more concerned about increasing likelihood of prolonged drought and global warming impacts on rainfall (Figure 4). These results may be related to the severe drought experienced by central and eastern Tennessee at the time of the survey (US Drought Monitor, 2011).
Figure 1.
Responses to Question A (by State)
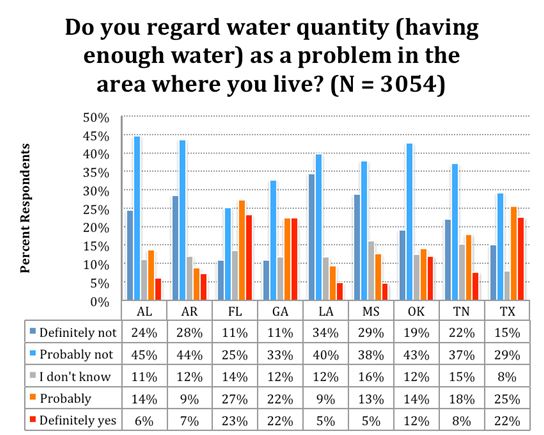
Figure 2.
Responses to Question B (by State)
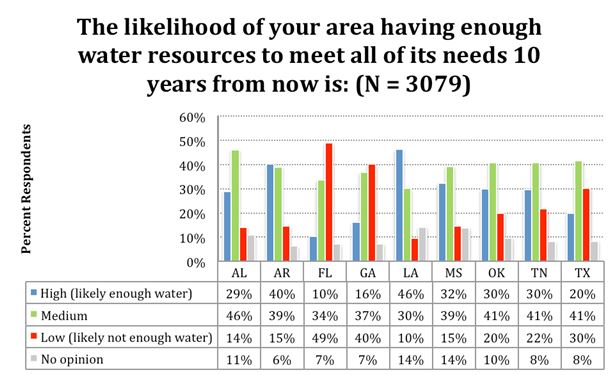
Figure 3.
Responses to Question C (by State)
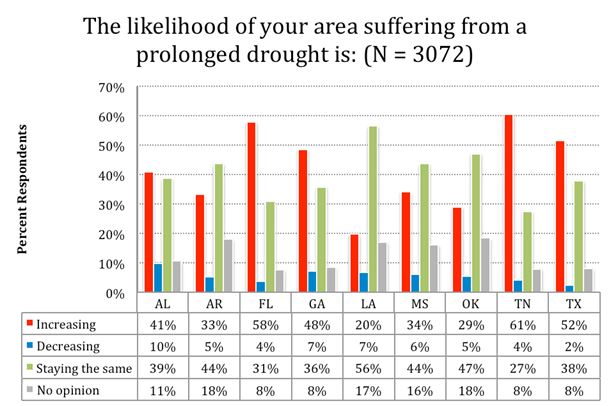
Figure 4.
Responses to Question D (by State)
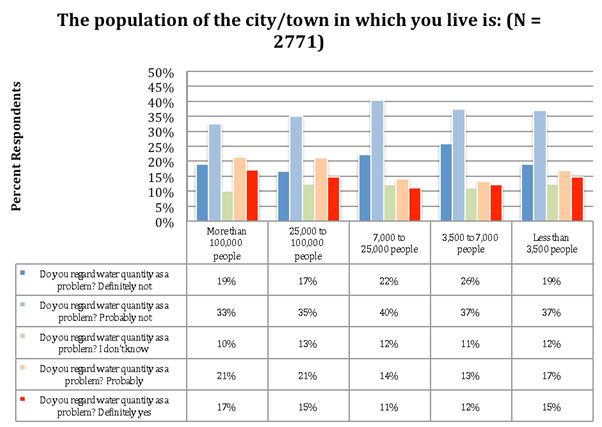
Interestingly, concerns about current water quantity were lower in communities with 3,500 - 25,000 residents, where only 25% of respondents believed in a (probable or definite) problem (compared with 36%-38% of those living in larger communities, Figure 5).
Figure 5.
Responses to Question A (by Community Size)
Duration of Residence, Education, Age, and Gender
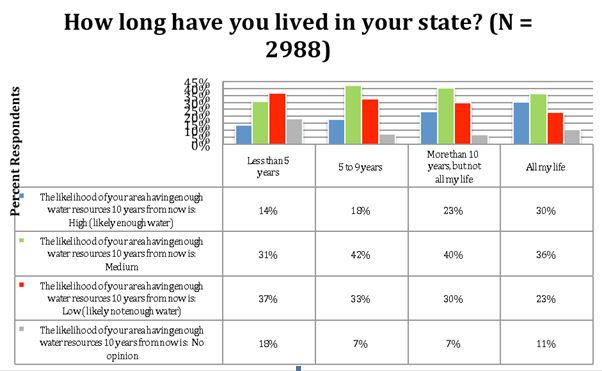
Respondents who resided in their states more than 10 years were less concerned about future water availability, compared with newcomers (Figure 6). Specifically, 30% of life-long residents believed the likelihood of having enough water in 10 years is high, compared with only 14% of newcomers.
Figure 6.
Responses to Question B (by Duration of State Residency)
Those with higher educational levels were generally more concerned about the environment, perhaps because of higher income or more concern about social problems (Van Liere & Dunlap, 1980). Based on the results of the research, respondents with advanced degrees were more likely to be concerned about future water availability (Figure 7) and the likelihood that prolonged drought is increasing (Figure 8).
Figure 7.
Responses to Question B (by Respondents' Education Level)
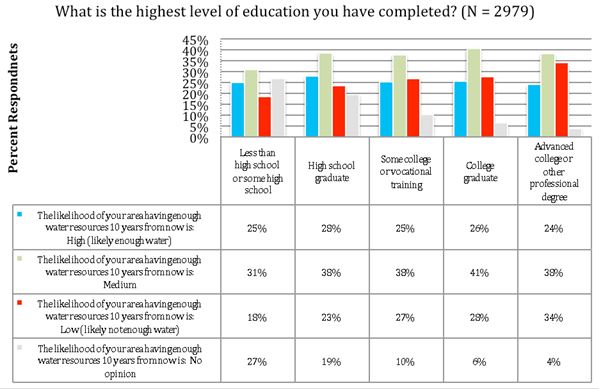
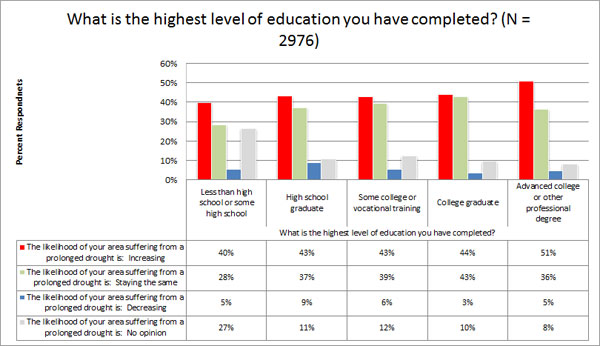
Figure 8.
Responses to Question C (by Respondents' Education Level)
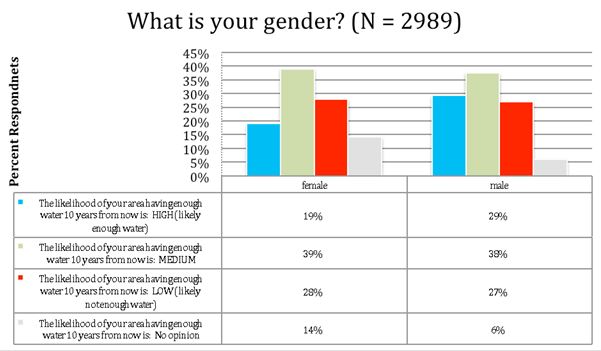
Environmental attitudes can also be driven by exposure to important historical events and/or age-dependent attitudes towards traditional values (Van Liere & Dunlap, 1980). Older respondents were more likely to be concerned about future water availability (Figure 9) and to believe that drought likelihood is increasing (Figure 10). Male respondents were relatively more optimistic about future water availability (Figure 11).
Figure 9.
Responses to Question B (by Respondents' Age)
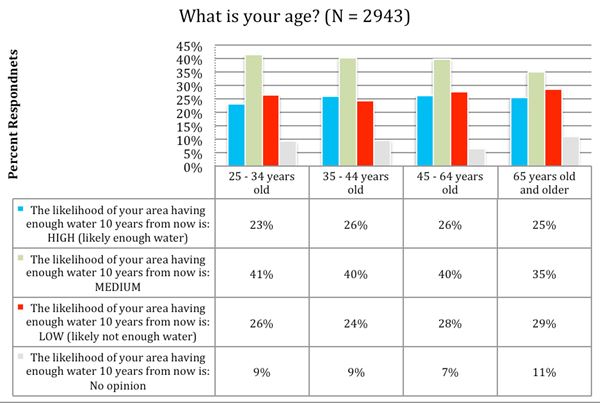
Figure 10.
Responses to Question C (by Respondents' Age)
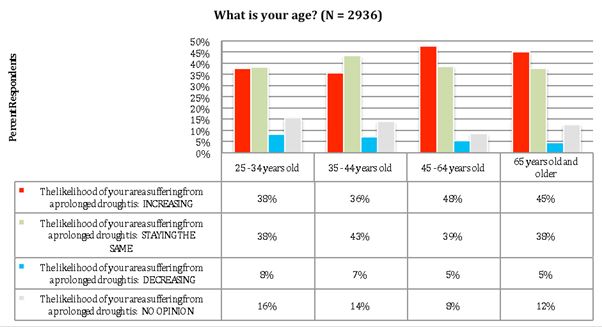
Figure 11.
Responses to Question B (by Respondents' Gender)
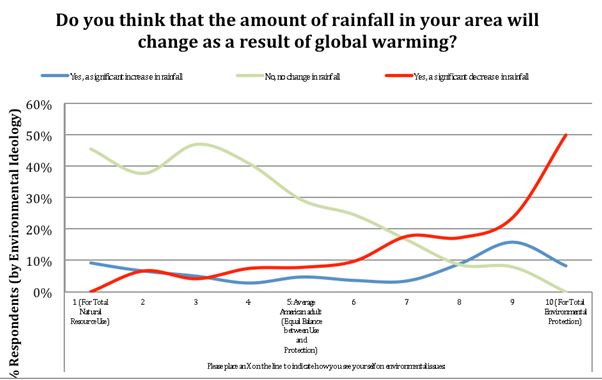
General Views about Environmental Protection (Ideology)
Consistent with existing literature (Dunlap & Van Liere, 1984), we find that views on water resource issues are linked to respondents' values/ideology. Figures 12 through 14 present selected results for respondents' views on drought likelihood, future water availability, and global warming effects on rainfall. These selected views are plotted against respondent ideologies scaled from (1) Total Natural Resource Use to (10) Total Environmental Protection. There was a positive correlation between the protectionist ideology and the view that the likelihood of prolonged drought is increasing (Figure 8). In contrast, there were positive correlations between the use ideology and the views that there will likely be enough water in 10 years (Figure 9) and that global warming will not change the rainfall (Figure 10).
Figure 12.
Responses to Question C (by Respondents' Environmental Ideology)
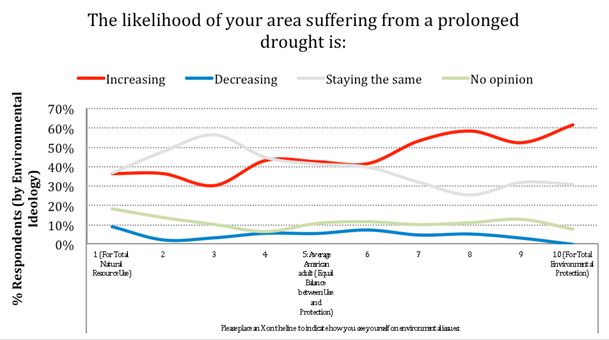
Figure 13.
Selected Responses to Question B (by Respondents' Environmental Values)
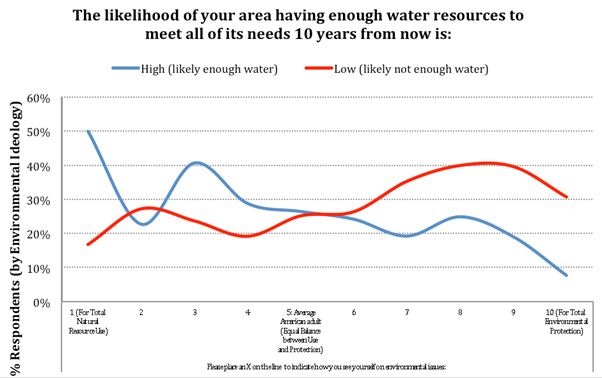
Figure 14.
Selected Responses to Question D (by Respondents' Environmental Values)
Performance of Individuals and Governments in Protecting Local Water Resources
We found that respondents' opinions on how well individuals are fulfilling their responsibility for protecting water resources (ranked from Very Well to Very Poorly) affect their concerns about having enough water (now and in 10 years) and the likelihood of prolonged drought. Specifically, the level of concern was higher among those who believed in very poor performance (corresponding figures are available upon request).
No Opinion and I Don't Know Responses
Factors that decreased the likelihood of respondents answering I don't know or No opinion included age group 45-64 years old (questions B and C), residence in the state for more than 10 years (question B), and residence outside city limits (with no involvement in agriculture, question D). Fewer Tennessee, Georgia, and Mississippi residents answered I do not know when asked about the likelihood of prolonged drought.
In contrast, the answers I don't know or no opinion were selected more frequently by females (questions B and C), those with less than a high school education (questions B, C, and D), and those involved in agriculture (question D). I do not know answers for questions A-D were associated with no definite opinion on performance of individuals and governments related to protecting local water resources. In Arkansas, Louisiana, Mississippi, and Oklahoma, more respondents answered I do not know/no opinion for questions about the likelihood of prolonged drought (questions C). Those in Arkansas and Oklahoma were also more likely to select I do not know for the question about global warming effects on rainfall (question D). Interestingly, life-long residents were also more likely to answer I do not know for the question about global warming effect on rainfall. Overall, these results suggest that water resource educational programs should target newcomers to the state, those with lower educational levels, and younger respondents. Outreach programs focused on global warming and water resources can have especially high impacts on respondents in Arkansas and Oklahoma.
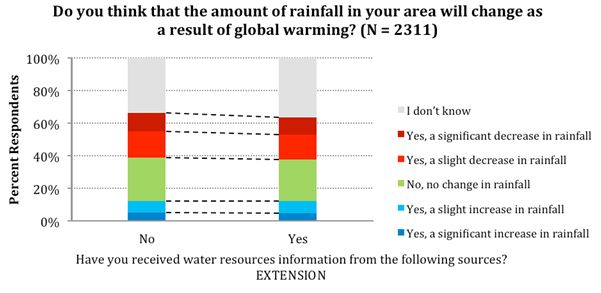
Extension clientele (i.e., those who indicated receiving water resource information from Extension) were less likely to answer No opinion/I do not know for questions about future water availability and likelihood of prolonged drought (Figure 15 & 16). In contrast, Extension clientele were more likely to answer I do not know for the question about the effect of global warming on rainfall (Figure 17), indicating an educational opportunity.
Figure 15.
Responses to Question B (Extension Clientele vs. General Public)
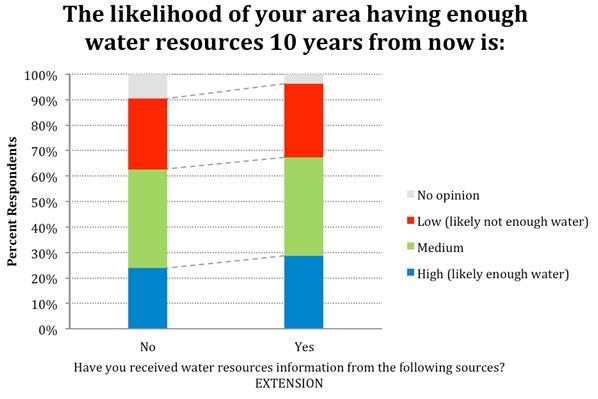
Figure 16.
Responses to Question C (Extension Clientele vs. General Public)
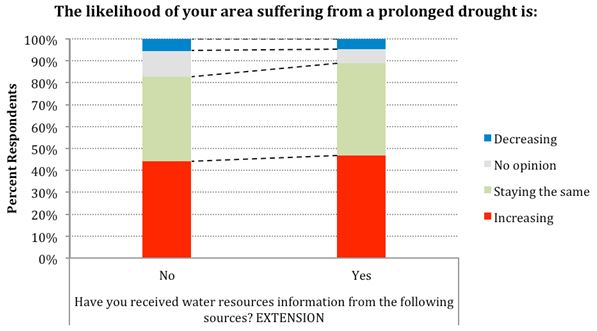
Figure 17.
Responses to Question D (Extension Clientele vs. General Public)
Conclusions and Implications
In this article we summarized responses to a public survey about water availability in nine southern U.S. states. Survey respondents were a little older, better educated, and more likely to be male than the general U.S. population. In Florida, Georgia, Tennessee, and Texas, the level of concern about water resources was higher relative to other states, with many respondents aware of current water quantity problems and believing in water shortages in their state in the next 10 years. These responses generally coincided with their evaluations of their state water resources agencies. Additional analysis should be conducted on how the drought conditions in these states near the time of the survey affected the survey responses.
Those with less than a high school education and those who had recently moved to their states were more likely to answer No opinion/I do not know to the questions about current and future water availability, indicating an educational opportunity. In addition, male respondents, younger respondents, those supportive of the idea of natural resource use (as opposed to environmental protection), and those who believed that individuals and/or government agencies are fulfilling their responsibility for protecting water resources well were relatively less concerned about current and future water availability. Concerns about water availability were also lower among those who had resided in their states more than 10 years and those residing in communities with 3,500-25,000 residents. In the regions where water conservation is becoming important, such residents should be a special target for educational programs.
In Arkansas and Oklahoma, the number of respondents who did not have an opinion about possible effects of global warming on rainfall was particularly high. Those who reported receiving Extension water resource information were also more likely to answer I do not know to the question about global warming and rainfall. Overall, high percent of I do not know responses to the global warming question can be due to the lack of accurate scientific forecasts about the global warming effects on the regional levels.
We did not analyze public opinions about water availability for public water supply, compared to in-stream water use (such as support for aquatic life or recreational opportunities). Additional analysis can be conducted to evaluate the effect of terminology used (e.g., global warming vs. climate change). Other potential effects of global warming on water cycle (such as the frequency of floods) can be evaluated. However, this is the first public opinion survey focused on water issues in the region, and it provides an important baseline for future studies.
Acknowledgments
This article is based on the analysis of survey responses collected by the authors as part of a national project led by Dr. Robert Mahler, University of Idaho. This survey project was partially supported by The Southern Regional Water Program, a partnership of the Texas AgriLife Extension Service, 21 collaborating Land Grant Universities in the Southern United States, and USDA (agreement 2008-51130-19537). Dr. Diane Boellstorff, Texas A&M University, and Karen Loeffelman, University of Idaho, also contributed to this survey project. Ms. Carol Fountain provided editorial help.
References
Dillman, D. A. (2007). Mail and Internet surveys: The tailored design method. 2007 update with new internet, visual, and mixed-mode guide. Hoboken, NJ: John Wiley & Sons, Inc.
Dunlap R. E., & Van Liere, K. D. (1984). Commitment to the dominant social paradigm and concern for environmental quality. Social Science Quarterly, 65(4), 1013-1028.
Kenney, P. (2008). A guide to econometrics (6th ed.). Malden, MA: Blackwell Publishing.
Mahler, R. L., Simmons, R., Sorensen, F., & Miner, J. R. (2004). Priority water issues in the Pacific Northwest. Journal of Extension [On line], 42(5). Available at: http://www.joe.org/joe/2004october/rb3.php
Mahler, R. L., Gamroth, M., Pearson, P., Sorensen, F., Barber, M E., & Simmons, R. (2010). Information sources, learning opportunities, and priority water issues in the Pacific Northwest. Journal of Extension [On-line], 48(2) Article 2RIB2. Available at: http://www.joe.org/joe/2010april/rb2.php
Prokopy, L. S., Molloy, A., Thompson, A., & Emmert, D. (2010). Assessing awareness of water quality: Comparing convenience and random samples. Journal of Extension [On-line], 48(3) Article 3FEA2. Available at: http://www.joe.org/joe/2010june/a2.php
SAS Institute Inc. (2008). SAS 9.2 software. Cary, NC: SAS Institute.
US Census Bureau. (2009a). Table 2: Annual estimates of the resident population by sex and age for Alabama: April 1, 2000 to July 1, 2008 (SC-EST2008-02-01). Retrieved from: http://www.census.gov/popest/data/state/asrh/2008/SC-EST2008-02.html
US Census Bureau. (2009b). Table 2: Annual estimates of the resident population by sex and age for Arkansas: April 1, 2000 to July 1, 2008 (SC-EST2008-02-05). Retrieved from: http://www.census.gov/popest/data/state/asrh/2008/SC-EST2008-02.html
US Census Bureau. (2009c). Table 2: Annual estimates of the resident population by sex and age for Florida: April 1, 2000 to July 1, 2008 (SC-EST2008-02-12). Retrieved from: http://www.census.gov/popest/data/state/asrh/2008/SC-EST2008-02.html
US Census Bureau. (2009d). Table 2: Annual estimates of the resident population by sex and age for Georgia: April 1, 2000 to July 1, 2008 (SC-EST2008-02-13). Retrieved from: http://www.census.gov/popest/data/state/asrh/2008/SC-EST2008-02.html
US Census Bureau. (2009e). Table 2: Annual estimates of the resident population by sex and age for Louisiana: April 1, 2000 to July 1, 2008 (SC-EST2008-02-22). Retrieved from: http://www.census.gov/popest/data/state/asrh/2008/SC-EST2008-02.html
US Census Bureau. (2009e). Table 2: Annual estimates of the resident population by sex and age for Mississippi: April 1, 2000 to July 1, 2008 (SC-EST2008-02-28). Retrieved from: http://www.census.gov/popest/data/state/asrh/2008/SC-EST2008-02.html
US Census Bureau. (2009f). Table 2: Annual estimates of the resident population by sex and age for Oklahoma: April 1, 2000 to July 1, 2008 (SC-EST2008-02-40). Retrieved from: http://www.census.gov/popest/data/state/asrh/2008/SC-EST2008-02.html
US Census Bureau. (2009g). Table 2: Annual estimates of the resident population by sex and age for Tennessee: April 1, 2000 to July 1, 2008 (SC-EST2008-02-47). Retrieved from: http://www.census.gov/popest/data/state/asrh/2008/SC-EST2008-02.html
US Census Bureau. (2009g). Table 2: Annual estimates of the resident population by sex and age for Texas: April 1, 2000 to July 1, 2008 (SC-EST2008-02-48). Retrieved from: http://www.census.gov/popest/data/state/asrh/2008/SC-EST2008-02.html
US Census Bureau. (2010). Profile of general population and housing characteristics: 2010. Washington, DC: US Census Bureau. Retrieved from: http://factfinder2.census.gov/faces/tableservices/jsf/pages/productview.xhtml?pid=DEC_10_DP_DPDP1&prodType=table
US Drought Monitor. (2011). Drought monitor archives. Lincoln, NE: The Drought Monitor. Retrieved from: http://droughtmonitor.unl.edu/archive.html
Water Council. (2008). Georgia comprehensive state-wide water management plan. Atlanta GA: The Water Council. Retrieved from: http://www.georgiawatercouncil.org/Files_PDF/water_plan_20080109.pdf
Van Liere, K. D., & Dunlap, R. E. (1980). The social bases of environmental concern: A review of hypotheses, explanations, and empirical evidence. The Public Opinion Quarterly, 44(2), 181-197