December 2013
|
December 2013 // Volume 51 // Number 6 // Feature // v51-6a7


Demographic Factors Affecting the Adoption of Multiple Value-Added Practices by Oklahoma Cow-Calf Producers
Abstract
Value-added programs are continually promoted by Extension personnel as avenues for improving cow-calf profitability, but producer adoption of value-added practices lags in spite of research that validates the value of these practices. Identifying producer characteristics that increase the likelihood of value-added practice adoption is critical to developing successful outreach efforts. Results from a survey of Oklahoma beef producers on value-added practice adoption indicate that multiple demographic variables influence a producer's likelihood of practice adoption. For Extension specialists, results can help in targeting likely adopters and developing methods to overcome barriers to adoption by producers less likely to adopt.
Introduction
While Extension personnel continually promote programs to improve cow-calf profitability, producer adoption of value-adding management and marketing practices lags. Value-added practices in the cow-calf phase of beef production primarily encompass management practices that positively affect health and performance in subsequent phases of production or document information such as age, origin, feed ingredients, or medical treatments for use in future marketing endeavors. Identifying producer characteristics that increase the likelihood of value-added practice adoption is critical to developing successful outreach efforts among cow-calf producers and, ultimately, to increasing participation in value-added practices and programs that may allow producers to capture higher market values for cattle.
Few researchers examine management practice adoption in the beef industry at the cow-calf level, and most focus on individual management practices rather than the number of practices adopted (Ward, Vestal, Doye, & Lalman, 2008; Gillespie, Basarir, & Schupp, 2004; Popp, Faminow, & Parsch, 1999). In Oklahoma, anecdotal evidence suggests cattle management practices and willingness to adopt may differ widely across the state, though such differences may be driven by other demographics. The study reported here explored the relationship between cow-calf producers' demographic characteristics and the number of value-added management practices implemented. An increased understanding of the impact of producer demographics on practice adoption can inform industry and Extension as to which producer populations would benefit from targeted educational programming regarding value-added management practices.
Data
A survey was developed to solicit information regarding producer adoption of management and marketing practices, in addition to producers' demographic information (OSU IRB AG094). Prior to mailing, the survey was pretested with a small subset of producers and county Extension educators and then refined based on feedback. The United States Department of Agriculture's (USDA) National Agricultural Statistics Service (NASS) Oklahoma City office was contracted to sample, send, and collect surveys and to compile survey data. The surveys were mailed directly from NASS to 17,511 of the 32,653 cow-calf producers in Oklahoma, covering over half of the state's cow-calf operations (USDA NASS 2007). The timing of the mailing allowed Extension educators to promote the survey, both pre- and post-mailing, extensively in the press as well as at multiple state, regional, and county meetings.
A total of 1,861 surveys were completed, resulting in a 12.1% response rate. Table 1 reports the survey response rate by region and herd size. (Note that Northwest includes the Panhandle region in Table 1. However, the Northwest and Panhandle regions are considered separately in the statistical analysis presented in this article.) Observations in which variables of interest had missing data were deleted, leaving 1,453 usable observations for the analysis and a usable survey response rate of 8.3%. Targeting the population more broadly via a larger sample source as opposed to sampling only those producers with prior contact with extension programming (i.e., convenience sampling) likely negatively influences our response rate, but also decreases the chance of selection bias and increases our ability to generalize beyond our survey respondents (Blair & Zinkhan, 2006). The similarity in cow-calf operator demographics between the 2007 Census of Agriculture respondents, previously published survey research, and our survey respondents, as discussed later, indicates that the data are representative of Oklahoma cow-calf producers.
| Quadrant | Sampled | Returned | Percent |
| NW* | 3,811 | 427 | 11.2% |
| NE | 4,605 | 578 | 12.6% |
| SE | 4,781 | 601 | 12.6% |
| SW | 4,314 | 505 | 11.7% |
| State | 17,511 | 2,111 | 12.1% |
| Herd size | |||
| 1-24 | 3,351 | 332 | 9.9% |
| 25-49 | 6,125 | 765 | 12.5% |
| 50-99 | 4,633 | 623 | 13.4% |
| 100-249 | 2,707 | 317 | 11.7% |
| 250-499 | 558 | 52 | 9.3% |
| 500+ | 137 | 22 | 16.1% |
| State | 17,511 | 2,111 | 12.1% |
|
*Includes the Panhandle of Oklahoma |
|||
Producers were asked about adoption of 14 management and marketing practices, including castration, deworming, feed bunk training, dehorning, weaning period, respiratory vaccinations, vaccination records, implanting, birth records, medical treatment records, individual calf identification, age and source verification, records for country of origin labeling, and no antibiotic use. These practices were identified as potential tools for adding value to calves or recommended by Extension personnel as best management practices. Each practice is known to increase sale prices of calves, yet many producers do not adopt these and other value-added practices. Questions regarding producer demographics were also asked (see below).
Methodology
Traditional economic theory suggests that cattle producers maximize expected utility and that a producer's utility is a function of profits as well as the labor necessary to obtain the profits. The management practices of interest are inputs that are expected to have a positive impact on revenue, but that are also expected to increase monetary costs and decrease leisure time.
However, producers may differ in level of risk aversion, in values placed on leisure time, or in levels of enjoyment (or dread) derived from implementing certain management practices. Labor cost and accessibility may also differ. These differences among producers may help to explain why some choose to adopt more value-added management practices than others, all else equal.
We employ a negative binomial regression model to examine the influence of producer characteristics on the number of recommended production practices adopted by a producer (Cameron & Trivedi, 1986; Gourieroux, Monfort, & Trognon, 1984). Producer characteristics included in the model as potential drivers of the adoption decision include herd size, geographic region, experience, age, education, total income, percent income from cattle, and participation in two educational programs—Oklahoma State University's (OSU) Master Cattleman program and Beef Quality Assurance training. The model is expressed as
E[Totali]= f(Herd Sizei, Regioni, Experiencei, Agei, Educationi, Annual Incomei, % Income from Cattlei, Trainingi)
where Totali is the total number of recommended practices adopted by producer i, and the independent variables are categorical measures of producer characteristics. The "base producer" is represented at the means of the demographic variables. Here, the base producer has a cowherd of 50-99 head, lives in the Southeast region, has more than 25 years of experience, is over 65 years old, has a high school diploma but no further education, makes $30,000 to $59,999 in annual income, attains 1-20% of total income from cattle, and has not participated in the Beef Quality Assurance Program or in the OSU Master Cattleman Program.
Marginal effects are calculated in order to interpret the magnitude of impacts on the number of practices adopted associated with changes in producer characteristics from the mean values of those characteristics, that is, the base producer. Standard errors of marginal effects are found using Monte Carlo Integration. A more complete explanation of the negative binomial model can be found in the SAS User's Guide (SAS, 2008).
Results
Descriptive statistics for survey respondents' characteristics are reported in Table 2. The typical herd size of respondents is less than 100 head, with 76% falling in this category. This is similar to the herd size distribution found in other surveys of Oklahoma producers. For example, Vestal et al. (2007) reported 68% of producers had commercial cowherds of less than 100 head, while the 2007 Census of Agriculture reported that 86% of Oklahoma cow-calf producers had herds of 100 or less (USDA-NASS 2007). Less than 1% of respondents have cow herds greater than 500 in number (0.83%), again consistent with the 2007 Census of Agriculture's finding that 0.84% of Oklahoma cow herds were larger than 500 cows. Similarly, the age distribution of survey respondents corresponds closely with that of Oklahoma cow-calf producers as reported by the 2007 Census of Agriculture (USDA-NASS 2007). Approximately 43% of survey respondents were above age 65. USDA-NASS (2007) reports that, in 2007, nearly 48% of Oklahoma cow-calf operators were above age 65. In contrast, USDA-NASS (2007) reports that only 5% of Oklahoma cow herd owners were under age 35. While age categories between the Census of Agriculture and our survey were not an exact match, the age distribution is similar. Less than 5% of survey respondents were under age 40. This is reflective of national trends as well, where McBride and Mathews (2011) report that the average age of U.S. cow-calf operators in 2008 was 61 while the percent of producers older than age 65 was 42%. Regarding the importance of income from cattle, more than 80% of survey respondents receive 40% or less of their income from cattle, again similar to Vestal et al. (2007) who found that 76% depended on cattle for 40% or less of household income.
| Category/Variable | Percent of Producers | Number of Producers |
| Herd Size | ||
| 1-24 | 14.52% | 211 |
| 25-49 | 29.25% | 425 |
| 50-99 | 32.69% | 475 |
| 100-249 | 18.65% | 271 |
| 250-499 | 4.06% | 59 |
| 500+ | 0.82% | 12 |
| Region | ||
| Northeast | 30.28% | 440 |
| Northwest | 15.07% | 219 |
| Panhandle | 1.45% | 21 |
| Southeast | 32.48% | 472 |
| Southwest | 20.72% | 301 |
| Years in Cattle Production | ||
| < 5 | 0.96% | 14 |
| 5 to 15 | 12.11% | 176 |
| 16 to 25 | 18.31% | 266 |
| > 25 | 68.62% | 997 |
| Age | ||
| < 30 | 0.41% | 6 |
| 31-40 | 3.99% | 58 |
| 41-50 | 13.42% | 195 |
| 51-64 | 39.64% | 576 |
| 65+ | 42.53% | 618 |
| Education | ||
| High school graduate | 34.34% | 499 |
| Vocational, Technical, or 2 year degree | 24.71% | 252 |
| Bachelor's Degree | 17.34% | 359 |
| Graduate or Professional Degree | 19.61% | 285 |
| None of these | 3.99% | 58 |
| Total Income | ||
| < $30,000 | 12.32% | 179 |
| $30,000-$59,999 | 27.19% | 395 |
| $60,000-$89,999 | 27.05% | 393 |
| $90,000-$119,999 | 15.97% | 232 |
| $120,000+ | 17.48% | 254 |
| Percent of Income from Cattle | ||
| 0% | 5.51% | 80 |
| 1-20% | 53.34% | 775 |
| 21-40% | 22.30% | 324 |
| 41-60% | 11.42% | 166 |
| 61-80% | 4.40% | 64 |
| 81-100% | 3.03% | 44 |
| Master Cattleman Program | ||
| Yes | 3.85% | 56 |
| No | 96.15% | 1397 |
| Quality Assurance Training | ||
| Yes | 7.71% | 112 |
| No | 92.29% | 1341 |
| Total practices adopted (Average) | 4.775 | |
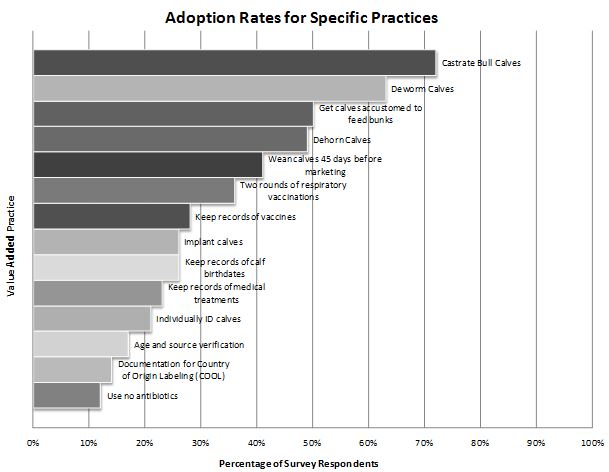
The degree of individual practice adoption reported by survey respondents is illustrated in Figure 1. The most widely adopted practice is castration of bull calves, with 72% of producers reporting practice adoption. Other common practices are de-worming calves (63%), getting calves accustomed to feed bunks (50%), and dehorning calves (49%). Not surprisingly, the least common practice is "no antibiotic use," with only 12% of producers employing this practice. A look at two of the most basic management practices suggests likely differences in adoption rates of management and marketing practices across herd size and across geographic region of the state. Previous research suggests geographic differences, even within a state, can be significant as in the Benham, Braccia, Mostaghimi, Lowery, and McClellan (2007) study of the impact of best management practice adoption on a Virginia watershed.
Figure 1.
Respondent Adoption Rates for Specific Value Added Management Practices
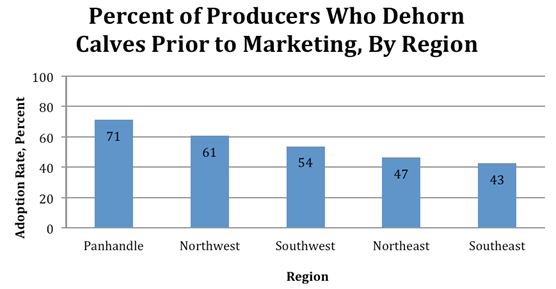
Knowledge of such differences is crucial for appropriately targeted educational programming. For example, Figure 2 presents a breakdown of producers by herd size employing castration as a standard management practice and suggests that herd size impacts practice adoption. Approximately 62% of producers with fewer than 25 head castrate bull calves prior to marketing and the percentage of producers doing so increases generally with herd size. For herds of 100-249, 250-499, and 500+ head, castration adoption rates are 85%, 90%, and 75%, respectively. Similarly, Figure 3 illustrates that regional differences exist in the adoption of the basic practice of dehorning calves. Generally speaking, dehorning rates decrease from west to east across the state. The highest adoption rate is in the Panhandle region (west) at 71% while the lowest is in the Southeast region at 47%. Size and regional differences likely exist for other management practices as well.
Figure 2.
Castration Adoption Rate by Herd Size
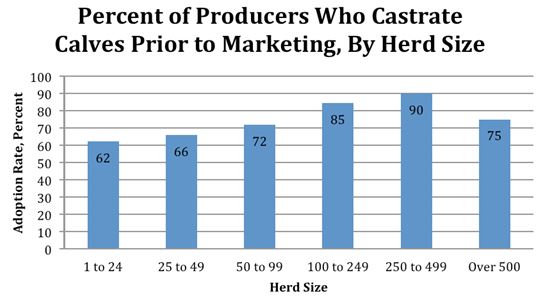
Figure 3.
Dehorning Adoption Rate by Region
Coefficient estimates as well as marginal effects are presented in Table 3. Marginal effects represent the change in the number of practices adopted when moving from the base producer to a particular demographic category. The base producer is a high school educated producer over 65 years old with 50 to 99 cattle located in the Southeast region. This base producer has 25+ years of experience and income between $30,000 and $59,999, earns between 1% and 20% of income from cattle, and has not participated in the Master Cattleman Program or quality assurance training. The number of practices adopted by the base producer is 5.62. Our results suggest that, statistically, the following producer demographics influence the number of practices adopted: herd size, geographic region, age, education, annual income, percent income from cattle, and participation in educational programs.
| Parameter | Parameter Estimate | Standard Error | p-value | Marginal Effect | Standard Error | p-value | |
| Intercept* | 1.210 | 0.082 | <0.001 | 5.612 | 0.963 | <0.001 | |
| Herd size | |||||||
| 1-25 head | -0.158 | 0.079 | 0.045 | -0.723 | 0.136 | <0.001 | |
| 25-49 head | -0.083 | 0.061 | 0.176 | -0.380 | 0.162 | 0.019 | |
| 100-249 head | 0.226 | 0.068 | 0.001 | 1.025 | 0.462 | 0.027 | |
| 250-499 head | 0.390 | 0.128 | 0.002 | 1.779 | 0.971 | 0.067 | |
| 500+ head | 0.275 | 0.254 | 0.279 | 0.772 | 3.193 | 0.809 | |
| Region | |||||||
| Northeast | 0.047 | 0.059 | 0.425 | 0.228 | 0.141 | 0.107 | |
| Northwest | 0.187 | 0.072 | 0.010 | 0.883 | 0.370 | 0.017 | |
| Panhandle | 0.407 | 0.188 | 0.030 | 1.956 | 1.113 | 0.079 | |
| Southwest | 0.110 | 0.066 | 0.092 | 0.535 | 0.359 | 0.136 | |
| Experience | |||||||
| < 5 years | -0.166 | 0.249 | 0.505 | -0.658 | 1.027 | 0.515 | |
| 5-15 years | -0.028 | 0.079 | 0.724 | -0.104 | 0.243 | 0.670 | |
| 16-25 years | 0.078 | 0.065 | 0.229 | 0.378 | 0.362 | 0.267 | |
| Age | |||||||
| < 30 years old | 0.592 | 0.347 | 0.088 | 2.846 | 1.434 | 0.047 | |
| 31-40 years old | 0.265 | 0.127 | 0.037 | 1.237 | 0.235 | <0.001 | |
| 41-50 years old | 0.280 | 0.075 | <0.001 | 1.302 | 0.137 | <0.001 | |
| 51-64 years old | 0.167 | 0.054 | 0.002 | 0.786 | 0.127 | <0.001 | |
| Education | |||||||
| No education | -0.152 | 0.128 | 0.235 | -0.647 | 0.263 | 0.014 | |
| Vocational, Technical, or 2-year degree | 0.074 | 0.062 | 0.237 | 0.247 | 0.091 | <0.001 | |
| Bachelor's Degree | 0.059 | 0.062 | 0.396 | 0.318 | 0.012 | 0.001 | |
| Graduate/Professional Degree | 0.052 | 0.069 | 0.449 | 0.234 | 0.121 | 0.053 | |
| Annual Income | |||||||
| < $30,000 | -0.157 | 0.083 | 0.059 | -0.755 | 0.402 | 0.060 | |
| $60,000- $89,999 | 0.063 | 0.064 | 0.321 | 0.251 | 0.392 | 0.522 | |
| $90,000- $119,999 | 0.100 | 0.074 | 0.174 | 0.432 | 0.303 | 0.155 | |
| $120,000+ | 0.088 | 0.074 | 0.235 | 0.411 | 0.346 | 0.235 | |
| Percent income from cattle | |||||||
| None | -0.130 | 0.108 | 0.230 | -0.582 | 0.230 | 0.011 | |
| 21-40% | 0.005 | 0.062 | 0.941 | 0.000 | 0.279 | 1.000 | |
| 41-60% | 0.039 | 0.082 | 0.637 | 0.184 | 0.247 | 0.941 | |
| 61-80% | 0.130 | 0.120 | 0.280 | 0.646 | 0.101 | <0.001 | |
| 81%+ | -0.007 | 0.150 | 0.961 | 0.094 | 0.046 | 0.039 | |
| Training | |||||||
| Master Cattleman graduate | 0.282 | 0.122 | 0.021 | 1.300 | 0.447 | 0.004 | |
| Quality assurance training | 0.290 | 0.089 | 0.001 | 1.337 | 0.051 | <0.001 | |
| Dispersion/scale | 0.535 | 0.033 | |||||
|
*Base producer demographics are: 50-99 head, Southeast region, more than 25 years experience, over 65 years old, high school diploma, $30,000 to $59,999 annual income, 1-20% of income from cattle, and no educational program participation (training). |
|||||||
Results indicate that herd size is an important consideration in the adoption of practices. In general, as herd size increases, producers are inclined to employ more value-added practices. The two smallest herd sizes (1-24 and 25-49) adopt fewer practices (0.7 and 0.4, respectively) relative to the base producer (50-99 head). Herd sizes larger than the base herd size adopt more practices, with approximately one additional practice for herds of 100-249 head and about two additional practices for herds of 250-499 head. The implication is that as herd size increases, the marginal cost of implementing certain management practices decreases, so larger producers may be more likely to adopt such practices. These results are consistent with Ward et al. (2008), who found that larger producers have higher rates of castration, vaccination, implanting, and individual animal identification than smaller producers. Given that the management practices surveyed do not require capital investment, this result indicates that there are costs to developing the human capital, i.e., management skills, needed to implement these practices. As herd size increases, these costs of investing in human capital can be spread over a larger number of calves, driving human capital cost per calf down while adding value to each calf. Thereby, the costs of developing human capital can be justified. It may also be true that a tipping point in herd size exists where acquiring labor to implement practices is difficult, lessening the adoption of additional practices, which could explain the lack of significance for the largest herds in this study.
Some regional differences are detected in the survey responses. Respondents in the Northwest report adopting almost one additional practice in comparison to the base region (Southeast), and Panhandle respondents report adopting about two additional practices. While resources and perhaps culture differ in the western half of the state from the Southeast, Southwest producers do not report a significant difference in the number of practices adopted. Wheat pasture is more abundant in the western half of the state, and so more stocker cattle are grazed by cow-calf producers. Prior to wheat pasture grazing, certain production practices, such as castration and vaccination, are almost always completed. For example, bull calves must be castrated prior to grazing to avoid discounts for "staggy" steers at sale. So the number of practices implemented in the western half of the state should be higher.
A producer life cycle effect is evident in the responses. Younger age groups adopt more practices than 65+ year old producers, and the number of additional practices adopted generally decreases as age approaches 65. At 31-40 and 41-50 years of age, about 1.2 to 1.3 additional practices are adopted. At 51-64, less than one additional practice is adopted. Young producers may be more open to aggressive management of calves. Middle-aged producers have perhaps already learned which of those practices are profitable in their own operations and have abandoned those that are not. When producers near retirement, the life-cycle effect becomes evident as they continue to decrease the extent of calf management. Older producers have shorter planning horizons and may perceive that they will not fully recognize the benefits of practice adoption, though much of the payoff from value-added practice implementation in feeder calves comes within the marketing year. Additionally, older producers may simply be less willing to change management practices than younger producers or may already have the knowledge to farm successfully, given their particular resources (Caswell, Fuglie, Ingram, Jans, & Kascak, 2001). In contrast, Gillespie, Kim, and Paudel (2007) found that as age increased, the probability of adopting conservation-related best management practices in beef cattle production increased. However, such practices tend to be more expense-increasing as compared to primarily revenue-increasing value-added management practices.
Producers with education beyond high school adopt more value-added practices than those with high school diplomas. The extent of post-secondary education does not seem important, as post-secondary marginal effects are positive and of similar magnitudes. These impacts range from about one-quarter to about one-third of an additional practice more than a producer with a high-school diploma. On the other end, producers without a high-school diploma are likely to adopt about two-thirds of a practice less than the base producer. In short, producers with at least a high school diploma are more likely to adopt more value-added practices than those without a high school education. This suggests that more highly educated producers are better able to assess the potential profitability of adopting value-added practices or have better access to information about the value of these practices. Partnering with high school agriculture programs to incorporate more information and exposure regarding value-added management practices for beef calves into program curriculum could be an important contact point for Extension.
There appears to be relatively little relationship between income levels and the number of management practices adopted. Incomes below $30,000 are associated with about 0.75 fewer practices adopted than the base of $30,000 to $59,999. Producer with incomes above $60,000 do not differ statistically from the base in the number of practices adopted. For some practices, the up-front cost of implementation may be perceived as prohibitive (e.g., vaccinations) by lower-income producers. Alternatively, low income could be associated with a high opportunity cost of investing in human capital and management, specifically for the cow-calf operation.
Producers deriving little income from cattle are likely to adopt fewer practices (about two-thirds of a practice) in comparison to a producer who derives 1-20% of income from cattle. One explanation may be that producers who own cow herds but derive a small percentage of total income from cattle may be "hobby" producers. This suggests that Extension programming specifically designed to reach this unique group has potential. In comparison to the base group, no statistical differences exist between producers deriving 21-40%, 41-60% and 81%+. However, producers deriving 61-80% of their income adopt about 0.6 more practices on average than the base group while those with 81% of income generated by the cattle operation adopt about a tenth of a practice more than the base group.
A finding with important implications for Extension programming is that participation in producer education programs such as Oklahoma State University's Master Cattleman program and the Beef Quality Assurance certification program increases value-added practice adoption by about 1.3. Participants in these programs likely have greater exposure to information regarding implementation of value-added practices and the associated benefits. This important finding validates the importance of targeted educational programming that relays research findings and communicates the value of various management practices. Our result corresponds with that of Duffy, Paterson, King, and Rolfe (2008), who found that management practice adoption rates were higher for BQA-trained cow-calf producers than for non-BQA-trained cow-calf producers in Montana, affirming that Extension and education efforts can increase producer adoption of technological change in agriculture. Overall, the findings indicate that well-designed and well-targeted Extension programming can be effective in encouraging value-added practice adoption.
Conclusions
The first step in developing Extension programming to expand the depth and breadth of adoption of value-added management practices is to determine the characteristics of current adopters and non-adopters. The study reported here investigated that issue. In summary, results suggest educated, larger producers who continued training in management practices are adopting recommended management practices. Less educated, lower income, smaller producers are the audience that can benefit most from improved management practices, but our results show that they are the least likely to implement these practices. Having verified the likely target audience, further research should identify impediments, specifically the perceived costs of investing in human capital, to the adoption of specific value-added practices and develop Extension programming designed to help producers to overcome impediments. The study reported here provides the initial assessment from which to build future studies.
Acknowledgments
Authors acknowledge funding support from the Oklahoma Cooperative Extension Service and the Departments of Agricultural Economics and Animal Science at Oklahoma State University.
References
Benham, B. L., Braccia, A., Mostaghimi, S., Lowery, J. B., & McClellan, P.W. (2007). Comparison of best management practice adoption between Virginia's Chesapeake Bay Basin and Southern Rivers Watersheds. Journal of Extension [On-line], 45(2) Article 2RIB3. Available at: http://www.joe.org/joe/2007april/rb3.php
Blair, E., & Zinkhan, G. M. (2006). Nonresponse and generalizability in academic research. Journal of the Academy of Marketing Science 34(1):4-7.
Cameron, A. C. & Trivedi, P. K. (1986). Econometric models based on count data: Comparisons and applications of some estimators and tests. Journal of Applied Econometrics 1:29-53.
Caswell, M., Fuglie, K., Ingram, C., Jans, S., & Kascak, C. (2001). Adoption of agricultural production practices: Lessons learned from the U.S. Department of Agriculture Area Studies Project. United States Department of Agriculture, Economic Research Service, Agricultural Economic Report No. AER792.
Duffy, L., Paterson, J., King, M., & Rolfe, K. (2008). Ranch management practices of Beef Quality Assurance (BQA) and non-BQA Certified producers in Montana. Journal of Extension [On-line], 46(5) Article 5RIB7. Available at: http://www.joe.org/joe/2008october/rb7.php
Gillespie, J. M., Basarir, M., & Schupp, A. (2004). Beef producer choice in cattle marketing. Journal of Agribusiness 22:149-161.
Gillespie, J. M., Kim, S., & Paudel, K. (2007). Why don't producers adopt best management practices? An analysis of the beef cattle industry. Agricultural Economics 36:89-102.
Gourieroux, C., Monfort, A., & Trognon, A. (1984). Pseudo maximum likelihood methods: Theory. Econometrica 52:681-700.
McBride, W. D., & Mathews, K., Jr. (2011). The diverse structure and organization of U.S. beef cow-calf farms. EIB-73. U.S. Department of Agriculture, Economic Research Service.
Popp, M. P., Faminow, M. D., & Parsch, L. D. (1999). Factors affecting the adoption of value-added production on cow-calf farms. Journal of Agricultural and Applied Economics 31:97-108.
SAS 9.2 User's Guide (2008). Retrieved from: http://support.sas.com/documentation/cdl/en/etsug/60372/HTML/default/viewer.htm#etsug_countreg_sect016.htm.
United States Department of Agriculture. National Agricultural Statistics Service (2007). 2007 Census of Agriculture. Retrieved from: http://www.agcensus.usda.gov/Publications/2007/Full Report/usv1.pdf
Vestal, M., Ward, C., Doye, D., & Lalman, D. (2007). Cow-calf production practices in Oklahoma – Part 1. Oklahoma Cooperative Extension Service. AGEC-245. Retrieved from: http://pods.dasnr.okstate.edu/docushare/dsweb/Get/Document-4570/AGEC-245web.pdf
Ward, C. E., Vestal, M. K., Doye, D. G., & Lalman, D. L. (2008). Factors affecting adoption of cow-calf production practices in Oklahoma. Journal of Agricultural and Applied Economics 40:851-863.