April 2013
|
April 2013 // Volume 51 // Number 2 // Research In Brief // v51-2rb6


Public Preferences for Water Resource Topics and Information Sources in the Southern United States
Abstract
In a 2008-2009 regional survey, one in six respondents indicated that s(he) received water resource information from Extension. Respondents were most interested in learning about protecting drinking water and fish and wildlife water needs. The interest in other topics depended on respondents' residence inside or outside city limits and involvement in agricultural activities. Respondents preferred learning about water resources from television coverage, newspaper articles, printed materials, or websites (for younger respondents).
Introduction and Objectives
Since the late 1980s, the United States (U.S.) Extension System has focused on water resource management through programs addressing the needs of all sectors of the population. However, the reach of these programs has not yet been measured, which leads to the following questions. How many U.S. adults have received water resource information from Extension? If Extension is expected to address the most critical water information needs of the population, what are those needs? Answering these questions is important for developing and marketing effective water resource education for both traditional and new clienteles (Abrams, Meyers, Irani, & Baker, 2010). In this article we seek to:
- Characterize the audiences reached by Extension water resource programs
- Evaluate the audiences' preferred sources, topics, and modes of receiving water resources information
Previous Studies
Warner, Christenson, Dillman, and Salant (1996) reported that nationwide telephone surveys in 1982 and 1995 indicated that 26% of respondents or members of their immediate families had used Extension services. Furthermore, Verma and Burns (1995) and Fleishman-Hillard Research (undated) showed Extension program public awareness levels of over 40% in Louisiana and 34% in Kansas. In Michigan, 38% were aware of agriculture and natural resources Extension programs specifically (Probyn, Suvedi, & Rosenbaum, 2005). Researchers characterized the Extension audience as largely rural (Verma & Burns 1995), white, and middle-aged or older (Probyn, Suvedi, & Rosenbaum, 2005; Warner, Christenson, Dillman, & Salant, 1996; Probyn, Suvedi, & Rosenbaum, 2005).
When asked without prompting which organizations in Florida conduct research and/or provide information about food, agriculture, and natural resources, 28% of the sampled agricultural producers and 23% of the sampled community leaders mentioned land-grant programs at the University of Florida. Of the respondents aware of the land-grant programs, 10% of agricultural producers and 24% of community leaders identified Extension programs related specifically to the environment (Abrams, Meyers, Irani, & Baker, 2010).
Fleishman-Hillard Research (undated) found local radio, television, and newspaper sources to be ranked very or somewhat effective for information delivery by 87% - 88% of Kansas respondents (for comparison, presentations and Internet were ranked very or somewhat effective by 75% and 44%, respectively, with Internet ranked higher by younger respondents). Finally, when asked about their interest in key Extension program areas, 61% of the Kansas respondents replied they were (very or somewhat) interested in environmental preservation, including preventing runoff and promoting water conservation (Fleishman-Hillard Research, undated).
While these studies provide information about public use and awareness of Extension, none focuses specifically on water resource Extension programs. This gap is addressed in this article.
Data and Method
In 2008-2009, a mail public survey of water-related attitudes and behaviors was implemented in eight southern states (Table 1). This survey instrument was based on a template developed in the Pacific Northwest (Mahler, Simmons, Sorensen, & Miner, 2004) and included approximately 60 questions about water resource issues and socio-demographics. Target sample size for each state was based on state population, with an error margin of no more than 4%, based on a 45% response rate (Dillman, 2007). A random sample of mailing addresses (balanced for equal representation of males and females) was purchased from Survey Sampling International (Fairfield, Connecticut). Over a 10-week period, selected individuals received two copies of the survey (with a pre-paid return envelope) and two reminder postcards. Total response rate was 51%, with 2,643 responses (response rates for individual questions varied).
In this article we focus on the following three survey questions:
- Have you received water resources information from the following sources? Thirteen sources were listed requiring yes or no for each.
- Would you like to learn more about any of the following water quality issue areas? (Check all that interest you). Answer choices included 16 to 17 areas.
- If you had the following kinds of opportunities to learn more about water issues, which would you be most likely to take advantage of? (Check up to 3 items). Twelve information delivery methods were listed.
For the first question, the list of information sources included both Extension and universities. We used frequency and logit regression analyses (Kenney, 2008) procedures in SAS 9.2 Statistical Software (SAS Institute, Inc., 2008) to identify the factors that increase the odds of respondents selecting yes for Extension or universities as sources of water resource information.
Findings
Survey respondents were somewhat older, better educated, and more likely to be male than the general population of the region (Table 1). Furthermore, the sampling was designed to assess each state individually rather than the entire region. A survey based on regional population would have been overwhelmed by the populations of Texas and Florida.
| Category | Demographics | % Survey Respondents | % Adult Population in Region |
| State of residence (n = 2,643) | Alabama (AL) (survey response rate = 47%) | 12% | 7%* |
| Arkansas (AR) (survey response rate = 61%) | 9% | 4%* | |
| Florida (FL) (survey response rate = 46%) | 17% | 29%* | |
| Mississippi (MS) (survey response rate = 42%) | 11% | 6%* | |
| Louisiana (LA) (survey response rate = 54%) (selected as a base for comparison with responses from other states) | 10% | 4%* | |
| Oklahoma (OK) (survey response rate = 53%) | 10% | 5%* | |
| Tennessee (TN) (survey response rate = 50%) | 13% | 9%* | |
| Texas (TX) (survey response rate = 33%) | 17% | 34%* | |
| Size of the community of residence (n = 2,392) | Greater than 100,000 residents | 31% | NA |
| Between 25,000 and 100,000 residents | 27% | NA | |
| Less than 25,000 (selected as a base for comparison with responses from larger cities) | 42% | NA | |
| City limits and involvement in agriculture (n = 2,558) | Residence outside city limits, not involved in agriculture (Rural, Non-Ag) | 34% | NA |
| Residence outside city limits, involved in agriculture (Ag) | 6% | 2%** | |
| Residence inside city limits (selected as a base for comparison with responses from residents from outside city limits) (Urban) | 60% | 83%** | |
| Duration of residence in the state (n = 2,558) | Respondents living in their states for less than 5 years | 5% | NA |
| Respondents living in their states for 5 to 9 years | 7% | NA | |
| Respondents living in their states for 10 years or more (selected as a base for comparison with responses from residents living in the state for a shorter time period) | 88% | NA | |
| Age (n = 2,518) | 25 - 34 years old | 6% | 21%* |
| 35 - 44 years old | 12% | 21%* | |
| 45 - 64 years old | 45% | 38%* | |
| 65 years old or older (selected as a base for comparison with respondents of other age categories) | 38% | 20%* | |
| Gender (n = 2,556) | Female | 36% | 52%* |
| Male (selected as a base for comparison with female respondents) | 64% | 48%* | |
| Educational level (n = 2,546) | High school education or less (selected as a base for comparison with respondents of other educational categories) | 25% | 44%*** |
| Some college or college degree | 55% | 45%*** | |
| Advanced degree | 20% | 11%*** | |
|
* For 8 southern states in 2008, based on US Census Bureau (2010a) ** For the country as a whole, based on USDA (2011) and USEPA (2009) *** For the country as a whole in 2010, based on US Census Bureau (2010b) |
|||
Extension as a Source of Water Resource Information
In question #1, respondents were asked to answer yes or no for each of 13 information sources. Nevertheless, 13% to 26% did not provide a response for specific information sources. For Extension and universities, non-respondents (25% and 24%, respectively) were more likely to be 65 years old or older, have only a high school education, and reside in Florida or Arkansas.
Of those who responded, 19% reported that they received water resource information from Extension, and 21% from universities. Although this shows considerably less reach than local newspapers (63%), environmental agencies (37%), and groups (30%), the population represented is 8.4-9.2 million people, assuming the total population aged 25 years old or older in the eight states is 44.0 million (US Census Bureau, 2010a). The impact of Extension and universities could even be much larger as mass media, environmental organizations, and state agencies often obtain their water resource information from these sources.
Extension and universities were used more frequently by those engaged in farming than by any other populations (Table 2). Use of Extension, in particular, declined as city size increased, perhaps reflecting the traditional targeting of Extension educational programs to agricultural and rural audiences. Interestingly, while the percentage of urban residents receiving water resource information from Extension was smaller than in rural areas, the total number of individuals reached in urban areas was much higher. There may have been some confusion by respondents of the association between Extension and university as sources of information; the correlation between Extension and university responses was weak (Phi coefficient = 0.38), implying that respondents may have associated university with undergraduate or graduate education, rather than with Extension programs.
| Information Source | Outside City, Engaged in Farming (n = 105) | City or Town Less Than 25,000 (n=667) | City or Town 25,000 to 100,000 (n= 447) | City Larger Than 100,000 (n=539) |
| Extension | 37% | 18% | 14% | 9% |
| Universities | 25% | 18% | 17% | 18% |
| Environmental groups | 19% | 24% | 27% | 34% |
| Environmental agencies | 33% | 31% | 30% | 35% |
| Local newspapers | 40% | 54% | 62% | 57% |
|
* Residence groups are defined based on their response to two survey questions: (1) Where do you live? And (2) The population of the city/town in which you live is? Missing or inconsistent responses were dropped from category totals. We do not report results for eight additional sources for water resource information that were considered in the survey. |
||||
Table 3 shows the result of logit regression analysis comparing the likely influence of various factors on selection of Extension and university as sources of water resource information. To avoid the dummy variable trap, one variable in each variable category was omitted from the regression. These omitted dummy variables constitute a "base scenario" of male resident of Louisiana with only a high school education, age 65 or older, residing inside city limits in a community of less than 25,000, and living in the state more than 10 years. Significant positive or negative deviation from this base scenario indicates a relatively important factor influencing the likelihood of selecting Extension or university as a source of water resource information. The odds of respondents reporting that they received water resource information from Extension was significantly greater for residents of Alabama, Arkansas, and Oklahoma, and for those living outside city limits and involved in agriculture. In contrast, significant negative deviation was predicted for those younger than 45 years old, residing in communities larger than 100,000 residents, and living in their states for less than 5 years.
| Variable | Source of Water Resource Information | |
| Extension | Universities | |
| Intercept (base scenario) | -*** | -*** |
| Residence Characteristics | ||
| AL | +** | |
| AR | +** | |
| FL | ||
| MS | ||
| OK | +** | |
| TN | ||
| TX | ||
| Residence in city, population greater than 100,000 residents | -*** | |
| Residence in city, population between 25,000 and 100,000 residents | -** | |
| Residence outside city limits, not involved in agriculture | ||
| Residence outside city limits, involved in agriculture | +*** | |
| Respondents living in their states for less than 5 years | -*** | -*** |
| Respondents living in their states for 5 to 10 years | ||
| Socio-Demographics | ||
| 25 - 34 years old | -** | |
| 35 - 44 years old | -** | |
| 45 - 64 years old | ||
| Gender - female | -*** | |
| Some college or college degree | +** | |
| Advanced degree | +*** | +*** |
| c (with c = 0.5 implying no predictive power in the model, and c = 1 implying absolute predictive power) | 0.67 | 0.60 |
| Likelihood Ratio Test (degrees of freedom = 19) | 98.54*** | 42.49*** |
|
*** Statistically significant at 99% confidence level ** Statistically significant at 95% confidence level |
||
Priority Topics for Extension Water Resources Programs
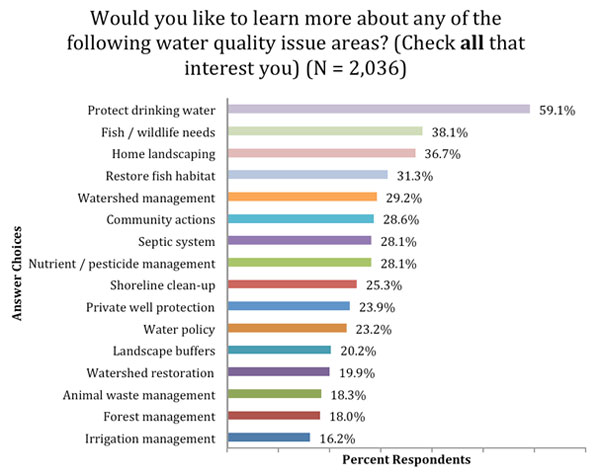
The three water quality issues of greatest interest to respondents were drinking water protection (59%), fish and wildlife water needs (38%), and home landscaping (37%) (Figure 1). The topics of highest interest for those living outside city limits (engaged in farming or not) included private well protection and septic system management (Table 4). For those not engaged in farming (and living inside or outside city limits), interest in home landscaping was relatively high. Hence, Extension programs must respond to the unique water resource information needs of both urban and rural clienteles in addition to addressing the topics of common interest to all residence categories.
Figure 1.
Respondent Preferences for More Information Regarding Water Quality Topics
| Where do you live? | ||
| Outside city limits, currently engaged in farming (N = 124) | Outside city limits, not engaged in farming (N = 685) | Inside city limits (N = 1,163) |
| Private well protection (61%) | Protect drinking water (54%) | Protect drinking water (63%) |
| Protect drinking water (48%) | Septic system management (45%) | Home landscaping (39%) |
| Septic system management (47%) | Fish and wildlife water needs (39%) | Fish and wildlife water needs (38%) |
| Fish and wildlife water needs (40%) | Home landscaping (36%) | |
| Watershed management (33%) | Private well protection (34%) | |
In addition to the 16 topics that were common among all the states, water rights, was added to the survey in Arkansas, Oklahoma, and Tennessee; in this group, 26% of respondents indicated that they would like to learn more about this topic.
Preferred Educational Methods
Respondents generally preferred to learn about water resources by watching television (49%); reading printed fact sheets, bulletins, or brochures (48%); visiting a website (41%); or reading a newspaper article (40%) (Figure 2). Those engaged in farming were relatively less likely to visit a website (26%) as compared with the respondents not involved in farming and residing inside or outside city limits.
Figure 2.
Preferred Learning Opportunities, by Respondent Residence Categories*
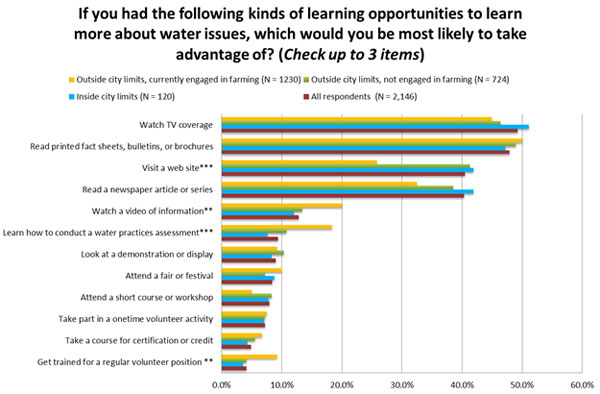
* chi-square test; statistically significant at 95% (**) and 99% (***) confidence levels
If Extension aspires to reach younger audiences, on-line methods of information delivery will be essential: 62% to 63% of respondents 25-44 years old indicated that they would prefer to visit a website to learn about water resource issues (Figure 3).
Figure 3.
Preferred Learning Opportunities, by Respondent Age Groups*
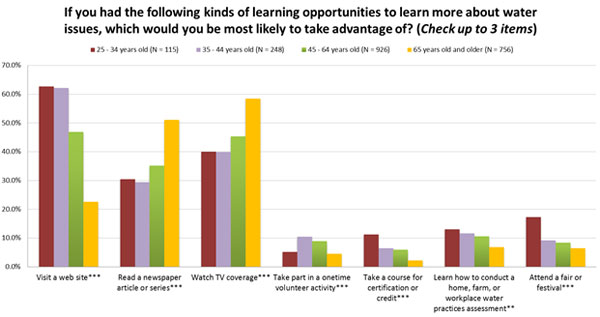
* chi-square test; statistically significant at 95% (**) and 99% (***) confidence levels
Conclusions
Overall, our results suggest that water resource Extension programs have reached a population of 8.4-9.2 million in the southern region. Similar to other studies, we found that older respondents and those engaged in farming reported receiving water resource information from Extension more frequently, reflecting the fact that the farming community is a key target audience for Extension programs. Only 9% and 18% of those living in large cities (with over 100,000 people) reported using Extension and universities, respectively; the number of people they represent is much larger than the traditional rural Extension clientele.
Borich (2001) identified the limited scope of issues addressed in educational programs as a primary barrier for Extension to expand its programs beyond rural audiences. We found the priority topic that respondents wanted to learn more about, across the board, was drinking water protection (59%). Priority issues in urban areas also included home landscaping (39%) and fish and wildlife water needs (38%). Hence, developing programs that address drinking water, environment, and home landscaping should increase the urban clientele base for Extension.
Preferred educational methods were generally watching television; reading fact sheets, brochures, and newspaper articles; and visiting websites. Almost two-third of respondents younger than 44 years old indicated that they would visit a website. While limited budget prohibits the use of mass media as a method of information delivery and marketing (Telg, Irani, Hurst, & Kistler, 2007), the Internet provides an effective and affordable way of reaching new (and younger) audiences.
The survey reported here sets a baseline for evaluating the public use of water resource Extension programs. It will be important to repeat the survey to evaluate changes in Extension use over time. Future survey projects could examine the use of Extension materials over specific time periods (e.g., in the past year) and focus on specific water resource Extension programs. Abrams, Meyers, Irani, and Baker (2010) reported that while stakeholders can generally be aware of the programs implemented by land-grant universities, they may not be able to tie these programs to Extension due to the low recognition of this brand name. Furthermore, Warner, Christenson, Dillman, and Salant (1996), Verma and Burns (1995), and Probyn, Suvedi, and Rosenbaum (2005) report the public can have a higher level of awareness about specific Extension programs than the Extension service as a whole. Additional questions about public satisfaction with and support for water resource Extension programs and the credibility of Extension as a source of water resource information could be included. Future studies could also be conducted in conjunction with Extension strategic planning efforts to help identify priority water resource issues extension should address in the region and the state.
Acknowledgments
This article is based on the analysis of survey responses collected as a part of a national project led by Dr. Robert Mahler, University of Idaho. This survey project was partially supported by The Pacific Northwest and Southern Regional Water Programs, a partnership of collaborating Land Grant Universities and USDA (Agreement Nos. 2008-51130-19537 and 2004-51130-02245). We would also like to acknowledge suggestions for this article by Carol Fountain, editor, Food and Resource Economics, University of Florida.
References
Abrams, K., Meyers, C., Irani, T., & Baker, L. (2010). Branding the land grant university: Stakeholders' awareness and perceptions of the tripartite mission. Journal of Extension [On-line], 48(6) Article 6FEA9. Available at: http://www.joe.org/joe/2010december/a9.php
Borich, T. O. (2001). The Department of Housing and Urban Development and Cooperative Extension: A case for urban collaboration. Journal of Extension [On-line], 39(6) Article 6FEA2. Available at: http://www.joe.org/joe/2001december/a2.php
Dillman, D. A. (2007). Mail and Internet surveys: The Tailored Design Method. 2007 update with new Internet, visual, and mixed-mode guide. Hoboken, NJ: John Wiley & Sons, Inc.
Fleishman-Hillard Research. (undated). Perceptions of the Kansas State University Research and Extension Program among Kansans. A report to The Kansas Agricultural Experiment Station and The Kansas Cooperative Extension Service. Fleishman-Hillard, Inc., St. Louis, MO.
Kenney, P. (2008). A guide to econometrics (6th edition). Malden, MA: Blackwell Publishing.
Mahler, R. L., Simmons, R., Sorensen, F., & Miner, J. R. (2004). Priority water issues in the Pacific Northwest. Journal of Extension [On-line], 42(5) Article 5RIB3. Available at: http://www.joe.org/joe/2004october/rb3.php
Mahler, R. L., Simmons, R., Sorensen, F., & Miner, J. R. (2005a). Public perceptions and actions towards sustainable groundwater management in the Pacific Northwest region, USA. International Journal of Water Resources Development, 21(3), 465-472
Mahler, R. L., Simmons, R., Sorensen, F., & Miner, J. R. (2005b). Drinking water issues in the Pacific Northwest. Journal of Extension [On-line], 43(6) Article 6RIB6. Available at: http://www.joe.org/joe/2005december/rb6.php
Probyn, L. K., Suvedi, M., & Rosenbaum, R. P. (2005). Exploring the baseline: What Michigan residents know about Michigan State University Extension. Journal of Applied Communications, 89(1), 35-49.
Telg, R., Irani, T., Hurst, A., & Kistler, M. (2007). Local marketing and promotional efforts of Florida Extension agents. Journal of Extension [On-line], 45(2) Article 2FEA5. Available at: http://www.joe.org/joe/2007april/a5.php
SAS Institute Inc. (2008). SAS 9.2 Software. Cary, NC: SAS Institute.
USEPA. (2009). Ag 101. Demographics. Retrieved from: http://www.epa.gov/agriculture/ag101/demographics.html.
USDA. (2011). About Us: Extension. Retrieved from: http://www.csrees.usda.gov/qlinks/Extension.html.
US Census Bureau. (2010a). Population Estimates. State—characteristics. Annual estimates of the resident population by sex and Age for States and for Puerto Rico: April 1, 2000 to July 1, 2009 (SC-EST2009-02-01, SC-EST2009-02-05, SC-EST2009-02-12, SC-EST2009-02-28, SC-EST2009-02-22, SC-EST2009-02-40, SC-EST2009-02-47, SC-EST2009-02-48). Retrieved from: http://www.census.gov/hhes/socdemo/education/data/cps/2010/tables.html
US Census Bureau. (2010b). Current population survey, 2010 annual social and economic supplement. Educational attainment in the United States: 2010—detailed tables. Table 1. Educational attainment of the population 18 Years and over, by age, sex, race, and Hispanic origin: 2010. Retrieved from: http://www.census.gov/hhes/socdemo/education/data/cps/2010/tables.html
Verma, S., & Burns, A. C. (1995). Marketing Extension in Louisiana: Image and opportunity. Journal of Extension [On-line], 33(6) Article 6RIB1. Available at: http://www.joe.org/joe/1995december/rb1.php
Warner, P. D., Christenson, J. A., Dillman, D. A., & Salant, P. (1996). Public perception of Extension. Journal of Extension [On-line], 34(4) Article 4FEA1. Available at: http://www.joe.org/joe/1996august/a1.php