April 2013
|
April 2013 // Volume 51 // Number 2 // Feature // v51-2a9


Using a Reverse Auction Approach to Promote Indoor Water Conservation
Abstract
Encouraging water conservation among residents is important even in high rainfall regions. Rebates are often used to encourage upgrades to water-efficient fixtures and appliances. The study reported here used a reverse auction approach to examine the amount of compensation needed for residents of water-rich regions to install water saving technology in their homes. Results showed that on average a 30% rebate was needed for residents to upgrade their fixtures and appliances. Lessons learned from the study can assist other Extension programs in implementing an auction-based approach for encouraging adoption of improved environmental practices in a community.
Introduction
Many urban areas of the country are seeing an increase in population growth, and as a result, there is an expanding competition for potable water supply. Although much focus has been placed on arid climates (Whitcomb, 1991; Spinti, Hilaire, & VanLeeuwen, 2004; Kenney, Goemans, Klein, Lowrey, & Reidy, 2008; Harlan, Yabiku, Larsen, & Brazel, 2009), few studies have examined water use and conservation strategies in other climatic regions of the country. House-Peters, Pratt, and Chang (2010) examined residential water consumption in the maritime temperate climate of the Pacific Northwest and determined that water use is dependent on household size, education level, and the size of the property's outdoor space. Mieno and Braden (2011) found that income was an important indicator of water demand in the Chicago metropolitan area and that water use and price responsiveness varied seasonally. Further research is needed to determine what motivates citizens to adopt water conservation strategies when water is inexpensive and seems to be in endless supply.
This is an excellent opportunity for Extension to partner with municipal and state water managers and investigate effective methods for changing residential behavior towards water use in perceived water-rich regions. For example, New Jersey on average receives 45 inches of rainfall per year. Regardless, the state's large population combined with increasing demand for potable water has left many municipalities vulnerable to water supply shortages (dePaul, Rosman, & Lacombe, 2008).
Other Extension programs have examined household water use and developed conservation strategies to help alleviate the impact of increased demand on limited water resources (Emmel, Parrott, & Beamish, 2003; Koenig et al., 2004). As part of a state-wide pilot program, Rutgers Cooperative Extension (RCE) is helping to develop a strategy to reduce residential indoor water consumption.
Adoption of indoor water-efficient technologies is an important part of reducing dependence on the potable water supply, especially in areas with older homes and outdated fixtures. Water-efficient products are certified through the United States Environmental Protection Agency's (EPA's) WaterSense® Program (www.epa.gov/WaterSense/) if they meet certain water use criteria (Table 1).
| Item | Federal Standard | WaterSense®Labeled | Savings (percent) |
| Faucet (gpm) | 2.2 | 1.6 | 28 |
| Showerhead (gpm) | 2.5 | 2.0 | 20 |
| Toilet (gpf) | 1.6 | 1.28 | 20 |
| gpm= gallons per minute, gpf= gallons per flush | |||
Previous studies that focus on the adoption of water conservation strategies have focused on water pricing, psychology, behavioral practices, and socio-economic factors that influence water use (Olmstead & Stavins, 2009; Russell & Fielding, 2010; Millock & Nauges, 2010; Grafton, Ward, To, & Kompas, 2011). Little information is available on the water savings achieved through the implementation of subsidy incentive programs. Kenney, Goemans, Klein, Lowrey, and Reidy (2008) found that rebate programs for indoor water-efficient technologies, such as toilet retrofits, reduced water consumption among participating households in Aurora, Colorado by 10%. A study in California by Renwick and Green (2000) found that free retrofit kits reduced average household water use by 9%, although rebates on toilets had no significant impacts. Similar studies are needed for climates of the eastern United States to determine whether subsidy programs that promote water efficiency have similar results.
The goal of the study reported here was to 1) help inform municipalities and local water purveyors as to the economic incentives needed to encourage adoption of low-flow indoor technologies and 2) determine whether an auction approach can be used to develop a cost-effective, economic incentive program that reduces indoor water consumption. To address the question of necessary size of economic incentives, a reverse auction was conducted to determine how to most effectively distribute funding to encourage the highest number of residents to adopt more water-efficient indoor technologies.
Study Area
The study focused on investigating incentives needed to upgrade to more water-efficient technologies in a community with older homes, where outdated fixtures and appliances might limit water conservation efforts. RCE collaborated on the pilot program with the City of Rahway, a densely populated municipality with 28,998 residents (7,269 people/mi2) in northeastern New Jersey, serviced by a municipally owned water system operated by a single provider—United Water of Rahway. Rahway is an ideal community to pilot an indoor water conservation program because close to 80% of the water use is indoors, with an average indoor consumption of 86 gallons per capita per day. Additionally, older homes are common in Rahway, with 76% of homes being built before 1970 (US Census Bureau, 2010).
Methods
Reverse Auction
The use of competitive bidding has been explored by Extension professionals as a strategy for encouraging adoption of an environmental practice by private landowners, most frequently for agricultural conservation practices (Clark, English, & Garland, 2007; Smith, Nejadhashemi, & Leatherman, 2009). More recently researchers have applied auction approaches to decentralized stormwater management practices in residential communities (Cutter, Baerenklau, DeWoody, & Sharma, 2008; Thurston, Taylor, Shuster, Roy, & Morrison, 2010). Most people think of auctions in the most standard form as having a single seller and many bidders. In a reverse auction—also called a "procurement auction"—there are multiple sellers competing for an award from a single buyer. Unlike standard auctions, once bids are submitted, the awards go to the lowest bidders. Normally, bids are weighted by the environmental effectiveness of installing a certain conservation improvement practice. In this way the most cost-effective bids are selected for funding, thereby increasing the effectiveness of the funds for implementing a range of conservation practices (Greenhalgh, Taylor, Selman, & Guiling, 2008).
If the bid includes a rebate or compensation amount, using a competitive bidding system helps to reveal the minimum compensation a participant would need as an incentive to adopt a best management practice. Because the process is competitive, participants are aware that bidding high would lower their chances of being selected. In the Rahway reverse auction, the management practice that was "sold" was the installation of new water fixtures and appliances, the "sellers" being the Rahway residents, and the "buyer" being Rutgers Cooperative Extension. To our knowledge, this is the first study investigating an auction approach for encouraging the adoption of water-efficient technologies by homeowners. This approach could be applied to a variety of Extension programs where the goal is to encourage adoption of best practices by a specific clientele.
Products and Auction Marketing
The auction was marketed to residents of Rahway through a program called "Name Your Rebate for Water Savings." A first price, sealed bid auction was used, meaning the bids are confidential, bidders cannot observe competitors' bids, and bidders receive the price stated in their bid (Latacz-Lohmann & Schilizzi, 2005). Single family homes were targeted because they were more likely to be resident owned and had a greater ability to upgrade to newer technologies than renters. Residents were encouraged to bid on rebates for up to 10 products. Rahway residents indicated the compensation they would need as an incentive to purchase the product. The items included in the auction were four high efficiency toilets, four faucets, one showerhead, and one washer because these products are typically the highest water users in the home. The showerhead, faucets, and toilets all met the EPA WaterSense® criteria (Table 1). A 4.0 cubic foot washer was chosen that was certified as meeting the strictest Tier III criteria for energy and water use by the Consortium for Energy Efficiency (www.cee1.org). The washer had a water factor of 3.4 gallons per cubic foot of laundry.
The program was promoted starting February 2010 via local newspapers, the city's website, and an automated phone call through the local water purveyor's Rapid Alert system. Residents were directed to bid online at the program website. A mailing was also conducted to 6,300 single-family homes with a brochure and application. While residents were not given any restrictions on the amount they could bid, they were encouraged to bid a low rebate amount and informed that applications would be chosen based on the lowest rebate bids. Once applications were assessed and rebates were awarded, households purchased products from two local vendors and were responsible for their own installation. Two types of rebates were awarded based on the vendor the product was purchased from: an instant rebate, where the discount was processed at the register, or a mail-in rebate, where households were reimbursed by providing proof of purchase.
Results and Discussion
Reverse Auction
Forty households submitted bids on 115 products, with the average rebate bid being 315 (±1.3). As indicated in Table 2, the lowest frequency bid was 60% off the product price, showing that participating households understood the reverse auction concept and that a high bid was not likely to grant them a rebate award. The highest frequency bid was on the washer (21 bids). The high cost of the washer and the potential for receiving a sizable rebate could have been a driving factor for its popularity among bidders. Fifty-eight percent of the households indicated that they heard about the program via the mailed brochure and application; 15% indicated the newspaper, and the remaining 28% indicated the local water purveyor automated call, the city website, or "other" as their source. This indicates that the mailing was the best method for advertising the program and that investment in targeted outreach to individual households was a worthwhile investment.
| Range of bids | 10% - 60% |
| Average rebate bid | 31±1.3 % |
| Highest frequency bid | 40% |
| Lowest frequency bid | 60% |
| Average number of bids per household | 3 |
| Total number of rebate bids | 115 |
| Product bid breakdown: | |
| toilets | 26 |
| faucets | 51 |
| washers | 21 |
| showerheads | 17 |
Table 3 summarizes rebate bids from all households that submitted applications and households that eventually installed products. Bids were accepted from all households except six that submitted rebate bids above the most frequent bid of 40% off the product price. We counter-offered a rebate of 40% to those six households in order to increase participation in the study. Among the 40 households that submitted bids, 17 accepted rebates and installed 28 products in their homes including 8 toilets, 11 faucets, eight washers, and one showerhead.
Among these households that installed products, rebate bids ranged from 10 to 50% of the product price. There was no statistically significant difference between the average rebate bid of the households that installed products and the households that did not install. This indicates that on average a rebate of approximately 30% on a water-efficient device was enough of an incentive for households to adopt water-efficient technology. Although data limitations prevent us from being able to determine whether incentives would need to vary by product, this is still valuable information for municipalities in water-rich regions to use when offering rebates to their residents as a method for achieving water savings. The washer and toilet #3 were still the highest and lowest frequency bids, respectively.
| Toilet 1 | Toilet 2 | Toilet 3 | Toilet 4 | Faucet 1 | Faucet 2 | Faucet 3 | Faucet 4 | Washer | Showerhead | |
| Product price before rebate | $148.00 | $198.00 | $293.00 | $530.00 | $44.00 | $68.00 | $89.00 | $66.70 | $700.00 | $39.00 |
| All Households | ||||||||||
| Number of Rebate Bids | 12 | 5 | 4 | 5 | 9 | 16 | 9 | 17 | 21 | 17 |
| Average Rebate Bid | 33% | 24% | 30% | 38% | 29% | 31% | 32% | 28% | 39% | 25% |
| Standard error | 4% | 7% | 9% | 4% | 4% | 4% | 5% | 3% | 3% | 3% |
| Households that purchased products | ||||||||||
| Number of Rebate Bids | 4 | 2 | 0 | 2 | 3 | 2 | 1 | 5 | 8 | 1 |
| Average Rebate Bid | 35% | 20% | 0% | 30% | 20% | 35% | 30% | 27% | 35% | 30% |
| Standard Error | 5% | 0% | 0% | 0% | 0% | 5% | 0% | 6% | 2.67% | 0.00% |
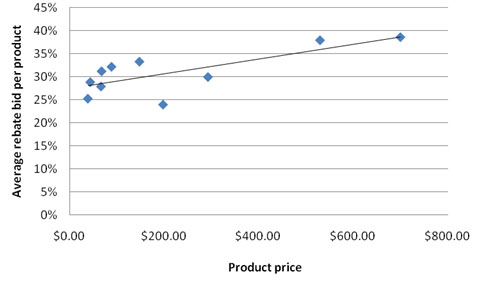
There was a positive correlation between rebate bid and product price among the 40 households that submitted bids (Figure 1, r=0.7506; p-value= 0.0124). This trend did not hold true among the households that installed products. Among the 17 households that accepted a rebate and installed products, there was no correlation between product price and rebate bids (r=0.2869, p-value= 0.4542).
Figure 1.
Correlation Between Rebate Bids and Product Price for All Applications (r=0.7506; p value= 0.0124)
Reduction in Water Use
Reductions in water use on an annual basis for homes that implemented the new technologies were estimated using manufacturers' estimates of water use volumes for each product (Table 4). Per capita daily water use for each technology was based on a residential water use study from 12 North American locations completed by the American Water Works Association (Mayer et al., 1999, DeOreo et al., 2001). Future water use monitoring of each home will be conducted to confirm that these reductions are realized. Table 5 shows total per capita annual water savings was estimated to be 97,309 gallons.
| Faucet | Showerhead | Washer | Toilet | |
| Pre-retrofit * | 2.75 gpm | 2.75 gpm | 39.00 gpl | 3.50 gpf |
| Post-retrofit** | 1.6 gpm | 1.5 gpm | 13.6 gpl ** | 1.28 gpf |
| Number of times used per capita per day*** | - | - | 0.37 | 5.05 |
| Pre-retrofit minutes used*** | 8.4 | 6.8 | - | - |
| Post-retrofit minutes used*** | 8.9 | 8.5 | - | - |
| Pre-retrofit- gpcd | 23 | 19 | 14 | 17.7 |
| Post-retrofit- gpcd | 14 | 13 | 5.0 | 6.5 |
| Per capita pre-retrofit annual water use | 8395 | 6935 | 5110 | 6461 |
| Per capita post retrofit annual water use | 5110 | 4745 | 1825 | 2373 |
| Per capita annual water savings | 3285 | 2190 | 3285 | 4088 |
|
(gpm= gallons per minute, gpl= gallons per load, gpf= gallons per flush, gpcd= gallons per capita per day) * Pre-retrofit water use was assumed to be equivalent to standard water use before the United States Energy Policy Act of 1992 (Vickers, 2001). ** Numbers based on manufacturer's estimates. Washer estimates of gallons per load determined by multiplying the water factor (3.4) by 4.0 cubic feet. *** Per capita daily use for each technology, pre- and post- retrofit, was based on numbers from DeOreo et al. 2001 and Mayer et al., 1999. |
||||
| Household | Product installed | Estimated per capita annual water savings (gallons) | Cost of product(s) | Estimated annual cost savings on water bill* |
| 1 | showerhead | 2190 | $27.30 | $8.76 |
| 2 | faucet | 3285 | $35.20 | $13.14 |
| 3 | faucet | 3285 | $47.60 | $13.14 |
| 4 | faucet | 3285 | $56.70 | $13.14 |
| 5 | washer | 3285 | $420.00 | $13.14 |
| 6 | washer | 3285 | $490.00 | $13.14 |
| 7 | washer | 3285 | $420.00 | $13.14 |
| 8 | toilet | 4088 | $371.00 | $16.35 |
| 9 | toilet | 4088 | $158.40 | $16.35 |
| 10 | faucet, faucet | 6570 | $108.99 | $26.28 |
| 11 | faucet, washer | 6570 | $460.02 | $26.28 |
| 12 | toilet, faucet | 7373 | $128.82 | $29.49 |
| 13 | washer, toilet | 7373 | $508.80 | $29.49 |
| 14 | toilet, washer | 7373 | $861.00 | $29.49 |
| 15 | toilet, faucet, faucet | 10658 | $253.63 | $42.63 |
| 16 | toilet, faucet, washer | 10658 | $549.60 | $42.63 |
| 17 | toilet, faucet, washer | 10658 | $713.60 | $42.63 |
| Total | 97309 | $5,610.66 | $389.24 | |
| *Based on City of Rahway's base water rate of $0.004/gallon. | ||||
Cost Savings
In terms of cost savings to the consumer, Table 5 shows the estimated per capita annual cost savings on each household's water bill. Results show that although the low-flow faucet and washer have similar cost savings on the water bill, the financial return on the faucet is realized sooner than on the washer. The faucet and the washer have an annual cost savings of $13.14 each. Taking into account the rebate, if four people live in the home, even the most expensive faucet will be paid off in less than a year, whereas the washer will take almost 8 years or more to pay off. Over the life of the product, the faucet will save more money than the washer on the household's water bill. This is important information for consumers to know when choosing which products to upgrade in their homes in order to save money. This may also explain why initially there was a positive correlation between product cost and rebate bid (Figure 1). It is possible that participants were attempting to adjust for the long-term financial savings by bidding a higher percentage of the product cost as price increased.
In terms of cost saving to the water purveyor or municipality, a goal of the study was to determine whether an auction approach can be used to develop a cost effective, economic incentive program that reduces indoor water consumption. The study can help determine how much savings can be achieved through an auction-based approach by comparing the cost of conducting the reverse auction versus the hypothetical scenario of paying the full price of all the products while achieving the same water savings. Total cost of rebate payout was $2,766.85 for all 17 households and 97,309 gallons of estimated annual water savings achieved. This equates to $0.028/per gallon of water saved. In comparison, the cost of paying the full price on all the products to all participating households would have been $8,377.50. This equates to $0.086/gallon of water saved, or a 63% increase over the auction based approach.
Lessons Learned
Based on our experience, there are a number of lessons for other Extension programs that use a reverse auction approach. To our knowledge, this is the first time such an approach has been implemented in a densely populated urban community with the intent to encourage water conservation. Because this was a new concept, it remained a challenge to develop marketing language that would appropriately explain the program. Seeing that households had the ability to bid any rebate amount, the reverse auction concept was clearly understood by participants, as evidenced by the majority of rebate bids being under 40% of the product price. Regardless, in order to increase participation, future studies should invest in testing marketing language to targeted communities before the program begins.
The program was marketed to approximately 6,000 households, but only 40 households applied. It is possible that the program was spread too thin, and in general marketing a reverse auction to such a large number of households is inappropriate. Historically, reverse auctions have been implemented where stakeholder numbers are in the hundreds in agricultural communities or more recently in discrete suburban neighborhoods (Bryan, Gatti, Connor, Garrod, & King, 2005; Smith, Nejadhashemi, & Leatherman, 2009; Thurston, Taylor, Shuster, Roy, & Morrison, 2010).
For this program, and for other urban communities implementing a reverse auction, participation could be increased by focusing on small neighborhoods with lower populations and investing in repeated marketing campaigns within those neighborhoods. A more focused approach is necessary to get the word out in an urban community, where there is no dominant communication method. The mailing was the best method for advertisement. Future programs should employ repeated mailings as well as door-to-door efforts to explain program details. Additionally, an effort should be made to increase the visibility of the program at local events and community meetings.
Keeping the program simple in terms of types of rebates awarded, coordination with product vendors, and variety of products, was essential to the success of the study. Multiple vendors were included in the program with different abilities for granting rebates. The mail-in rebate proved to be a better method for tracking participation as it provided a record that the household had actually purchased the item for which they bid. Different product price at the time of purchase proved to be a challenge as households had based their rebate bids on the price quoted in the brochure. Future programs should work with vendors to maintain the product price throughout the length of the program.
Conclusions
The study reported here aimed to determine what economic incentives are necessary to encourage the adoption of indoor water saving technologies by residents of older homes in a perceived water-rich region. Based on the results, on average a 30% subsidy was necessary for households to upgrade to more water-efficient products. If the program had simply awarded products without the auction-based approach, the opportunity to collect valuable information about necessary incentives and willingness of homeowners to upgrade would have been lost.
Based on manufacturer's estimate of water use volumes, the total per capita annual water savings for the 17 homes that implemented the water-efficient technologies is 97,309 gallons. A cost savings of 63% per gallon saved will potentially be achieved using the auction-based approach for distributing subsidy incentives. Future water use monitoring will further determine the effectiveness of the upgrades. Last, this project also considered long-term cost savings for the consumer when upgrading to water-efficient technologies. It was determined that greater long-term financial savings could be achieved on the household's water bill by purchasing the lower cost products.
Additional research is needed in order to inform water managers in high rainfall regions about best methods for encouraging water conservation among their constituents. Implementing similar programs in a variety of communities would be informative for understanding whether variables such as household income or water pricing (flat rate payment verses metering) have an influence over necessary economic incentive for adoption of water-efficient technologies. The study reported here incorporated little education regarding the need for water conservation, which could have an impact on participation and adoption rates. Future research could look at the impact of incorporating public education to targeted households verses households that only receive information about the auction.
Acknowledgments
Funding for this project was provided by the New Jersey Department of Environmental Protection. The authors would like to thank the participating vendors, W.A. Birdsall & Co. and Home Depot, as well as project partners, the City of Rahway and United Water of Rahway.
References
Bryan, B., Gatti, S., Connor, J., Garrod, M., & King, D. (2005). Catchment care—Developing an auction process for biodiversity and water quality gains. A NAP Market-Based Instrument Pilot Project. CSIRO Land and Water and the Onkaparinga Catchment Water Management Board.
Clark, C. D., English, B. C., & Garland, C. D. (2007). Competitive bidding as a means of extracting and demonstrating farmer willingness-to-grow an alternative crop. Journal of Extension [On-line], 45(2) Article 2IAW5. Available at: http://www.joe.org/joe/2007april/iw5.php
Cutter, W. B., Baerenklau, K. A., DeWoody, A., & Sharma, R. (2008). Costs and benefits of capturing urban runoff with competitive bidding for decentralized best management practices. Water Resources Research, 44(W09410). doi:10.1029/2007WR006343.
DeOreo, W., Dietemann, A., Skeel, T., Mayer, P.W., Lewis, D.M., & Smith, J. (2001). Retrofit realities. Journal of American Water Works Association, 93(3), 58-72.
Emmel, J. M., Parrott, K., & Beamish, J. (2003). Dishwashing and water conservation: An opportunity for environmental education. Journal of Extension [On-line], 41(1). Article 1RIB3. Available at: http://www.joe.org/joe/2003february/rb3.php
dePaul, V., Rosman, R., & & Lacombe, P. (2009). Water-level conditions in selected confined aquifers of the New Jersey and Delaware Coastal Plain, 2003. Reston, VA.: U.S. Geological Survey. Retrieved from: http://pubs.usgs.gov/sir/2008/5145/pdf/SIR2008-5145.pdf
Grafton, R. Q., Ward, M. B., & To, H. (2011). Determinants of residential water consumption: Evidenence and analysis from a 10-county household survey. Water Resources Research, 47(W08537). doi:10.1029/2010WR009685.
Greenhalgh, S., Taylor, M., Selman, M., & Guiling, J. (2008). Reverse auctions: Are they a cost-effective alternative to traditional agricultural conservation spending? American Agricultural Economics Association Annual Meeting, (p. 25). Orlando, FL, July 27-29, 2008.
Harlan, S. L., Yabiku, S. T., Larsen, L., & Brazel, A. J. (2009). Household water consumption in an arid city: Affluence, affordance, and attitudes. Society and Natural Resources, 22(8), 691-709.
House-Peters, L., Pratt, B., & Chang, H. (2010). Effects of urban spatial structure, sociodemographics, and climate on residential water consumption in Hillsboro, Oregon. Journal of American Water Resources Association, 46(3), 461-472.
Kenney, D. S., Goemans, C., Klein, R., Lowrey, J., & Reidy, K. (2008). Residential water demand management: Lessons from Aurora, Colorado. Journal of American Water Resources Association, 44(1), 192-207.
Koenig, R., Cerny-Koenig, T., Hefelbower, R., Mesner, N., Kopp, K., & Hill, R. (2004). A team approach enhances statewide water issues programming. Journal of Extension [On-line], 42(3). Article 3TOT5. Available at: http://www.joe.org/joe/2004june/tt5.php
Latacz-Lohmann, U., & Schilizzi, S. (2005). Auctions for conservation contracts: A review of the theoretical and empirical literature. Scottish Executive Environment and Rural Affairs Department. Retrieved from: http://www.scotland.gov.uk/Resource/Doc/93853/0022574.pdf
Mayer, P. W., DeOreo, W. B., Opitz, E. M., Kiefer, J. C., Davis, W. Y., Dziegielewski, B., & Nelson, J. O. (1999a). Residential end uses of water. American Water Works Association (AWWA).
Millock, K., & Nauges, C. (2010). Household adoption of water efficient equipment; The role of socio-economic factors, environmental attitudes, and policy. Environmental Resource Economics, 46(4), 539-565.
Mieno, T., & Braden, J. B. (2011). Residential demand for water in the Chicago metropolitan area. Journal of the American Water Resources Association, 47(4), 713-723.
Olmstead, S. M., & Stavins, R. N. (2009). Comparing price and nonprice approaches to urban water conservation. Water Resources Research, 45(W04301). doi:10.1029/2008WR007227.
Renwick, M. E., & Green, R. D. (2000). Do residential water demand side management policies measure up? An analysis of eight California water agencies. Journal of Environmental Economics, 40(1), 37-55.
Russell, S., & Fielding, K. (2010). Water demand management research; A psychological perspective. Water Resources Research, 46(W05302). doi:10.1029/2009WR008408
Smith, C. M., Nejadhashemi, A. P., & Leatherman, J. C. (2009). Using a BMP Auction as a Tool for the Implementation of Conservation Practices. Journal of Extension [On-line], 47 (4). Article 4FEA7. Available at: http://www.joe.org/joe/2009august/a7.php
Spinti, J., Hilaire, R. S., & VanLeeuwen, D. (2004). Balancing landscape preferences and water conservation in a desert community. Horttechnology, 14(1), 72-77.
Thurston, H. W., Taylor, M. A., Shuster, W. D., Roy, A. H., & Morrison, M. A. (2010). Using a reverse auction to promote household level stormwater control. Environmental Science and Policy, 13(5), 405-414.
Vickers, A. (2001). Handbook for water conservation. Amherst, Massachusetts: Waterplow Press.
Whitcomb, J. B. (1991). Water reductions from residential audits. Water Resource Bulletin, 27(5), 761-767.
US Census Bureau. (2010). US Census selected housing characteristics: 2005-2009. Retrieved from: http://factfinder.census.gov/