February 2012
|
February 2012 // Volume 50 // Number 1 // Research In Brief // v50-1rb6


Demographic Factors Influence Environmental Values: A Lawn-Care Survey of Homeowners in New Jersey
Abstract
The success of Extension programs in motivating homeowners to adopt good lawn management practices will likely depend on addressing their personal values. A survey for homeowners in New Jersey assessed attitudes about lawn care and environmental impacts, and determined which demographic factors related to these values. As in previous surveys, the study reported here found that homeowners valued both environmental conservation and having attractive lawns. A cluster analysis divided respondents into two groups, with one more highly valuing environmental concerns, but membership in this group did not translate into better horticultural practices.
Introduction
Several potential contaminants to water resources from lawns—including fertilizers, pesticides, and pet wastes—make Extension education for homeowners about good lawn care practices important. Educating homeowners about the importance of good practices, however, may be more difficult than educating professional landscapers. This may be because homeowners may have less knowledge about horticulture, and even a small geographic area may contain many individual homeowners in charge of lawn maintenance.
Motivating homeowners to adopt good lawn management practices will likely depend on addressing their values to effect behavior change. Extension education tactics might change, for example, if a group of homeowners value environmental conservation over having an aesthetically perfect lawn, saving money, or protecting their children from exposure to lawn chemicals.
Recent surveys of attitudes in Nebraska and Missouri have found homeowners place high value on environmental issues, but also value aesthetically attractive lawns (Sewell, McCallister, Gaussoin, & Wortmann, 2010; Hefner, Robertson, Coulter, & Stevens, 2009). There was the suggestion that these attitudes, though, may not translate into good practices, since, for example, Sewell et al. (2010) found that only 3% of respondents had ever tested their soils.
In the horticulture industry, it has been found that survey respondents could be assigned into clusters of those who adopt either a high percentage or low percentage of good management practices (Sellmer, Ostiguy, Hoover, & Kelley, 2004) and that the adoption of good management practices may be dependent on some demographic data, like the size of the operation (Mangiafico, Newman, Mochizuki, & Zurawski, 2008).
The study reported here was undertaken to see if homeowner respondents to a lawn care survey could be divided into groups according to their values and knowledge, and if so, what demographic factors may affect membership in those groups.
Methods
Survey Description
An online survey of homeowner's attitudes, knowledge, and practices concerning lawn care was conducted in April and May 2010 in five municipalities in New Jersey. The survey was posted online, and advertising was conducted through a variety of methods, including emails and mailings from municipalities, announcements in newspapers, and university and county websites. The municipalities were chosen for their diversity: ranging from suburban to rather urban; from median to high income; and including towns in the metropolitan areas of New York, Philadelphia, and Atlantic City. Total combined population of the municipalities was greater than 65,000 (2000 Census). The survey contained 43 questions covering pesticide use, fertilizer use, lawn horticulture, and value of home lawns, as well as demographic information like sex, age, and income.
Statistical Analysis
Point values were assigned for responses to questions related to environmental or horticultural attitudes, knowledge, or practices, and these point values were summed to create one of six response indices (Table 1). Typical questions asked for an agree or disagree response on a 5-point scale, with 5 points being awarded for a strongly agree, 4 points for an agree, etc. Points were assigned so that attitudes tending toward environmentalism, horticultural knowledge, and good horticultural practices were scored as higher values.
A cluster analysis was performed to divide respondents into groups based on their scores on attitudes and knowledge response indices. (This was based on a best-fit Gaussian model [Fraley & Raftery, 2006]). A multivariate analysis of variance (MANOVA) was conducted to determine if means for response indices were different among these groups. Finally, a logistic regression was performed to determine if responses on demographic questions were significant predictors of group membership. A logistic regression predicts the value of a dichotomous variable (in this case, belonging to one group or the other) as a function of a set of independent variables (in this case, the demographic factors). (A stepwise procedure was used to add these factors to the model, and a factor needed to maintain a p-value < 0.15 to remain included in the final model.) All analyses were performed in R (R Development Core Team, 2010), with the mclust package used for cluster analysis, and the manova and glm functions in the stats package were used for MANOVA and logistic regression, respectively.
Results
Survey Responses and Demographics of Respondents
One-hundred nineteen surveys were completed. Because of the advertising method, it is not possible to estimate the response rate. Respondents reported hearing about the survey from a variety of sources including newspapers, municipal emails or newsletters, and university websites.
Overall, respondents varied widely in their responses to demographic questions. The age of respondents ranged from in their twenties to in their sixties, with a median age in their fifties. Reported household income of respondents ranged from $30,000 to over $150,000, and education level varied from high school completion to Ph.D. completion. In response to a question asking for self assessment on a conservative-liberal scale, respondents varied in their responses across the full range of options, with a relatively uniform distribution. Sex of respondents was relatively equal, with 53% female, 41% male, and 6% not responding. These observations suggest that respondents represented a fairly wide cross-section of homeowners.
Response Indices for Attitudes, Knowledge, and Practices
Overall, responses indicated a high degree of expression of environmental attitudes and horticultural knowledge, with median scores on the response indices of Pesticides attitudes, Horticultural knowledge, Lawn as watershed value, and Self-reported environmentalism of 84%, 76%, 76%, and 72% of total possible points, respectively (Table 1). Scores for the Lawn not for aesthetic value index were lower, with a median score of 40% of possible points, with respondents valuing lawns for greenness (mean importance of 3.0 out of 5.0) and property values (mean importance 3.5 out of 5.0). These results agree with Sewell et al. (2010) and Hefner et al. (2009), who found that homeowners placed importance on environmental protection but also valued the aesthetic and economic value of manicured lawns.
| Scores by percentile of respondents (percent of total possible points) | |||||||
| Response index | No. of questions | Example or explanation | Min. % | 25th % | Median % | 75th % | Max. % |
| Pesticides attitudes | 10 | "The gains of applying pesticides to a lawn aren't worth the environmental risk." | 44 | 78 | 84 | 96 | 100 |
| Horticultural knowledge | 14 | "The lawn can use nutrients from the soil efficiently only if the soil has the proper pH." | 28 | 65 | 76 | 87 | 100 |
| Horticultural practice | 10 | "I test my soil and adjust the soil pH with the addition of lime or sulfur." | 0 | 14 | 36 | 50 | 86 |
| Lawn as watershed value | 2 | Lawns are valued for soil erosion prevention and rain infiltration. | 20 | 60 | 76 | 87 | 100 |
| Lawn not for aesthetic value | 4 | Lawns valued for infiltrating water and for recreation, more than for being dark green and increasing home values | 10 | 30 | 40 | 55 | 85 |
| Self-reported environmentalism | 1 | Environmental concerns are more important than economic concerns. | 11 | 56 | 72 | 89 | 100 |
Scores for the Horticultural practices index was low, with a median score of 36% of possible points. Scores varied among individual practices for this index, however. For example, while only 18% reported soil testing to adjust soil pH, 89% of respondents reported either checking weather forecasts before applying pesticides or not applying pesticides at all. Overall, homeowners did not necessarily adopt a high percentage of good practices, but did adopt some, particularly those related to pesticide application.
Groups of Respondents and Relationship to Environmental Values
The cluster analysis found that the best-fit model assigned survey respondents to two groups, with Group 1 containing 44 respondents, and Group 2 containing 75 respondents.
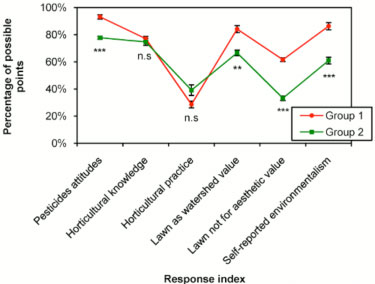
The MANOVA found a significant effect of the groups on response indices (p-value for Wilks statistic < 0.0001), with significant effects on four of the six indices (p < 0.05): Pesticides attitudes, Lawn as watershed value, Lawn not for aesthetic value, and Self-reported environmentalism (Figure 1). For each of these indices, Group 1 had a significantly higher average than did Group 2, indicating that Group 1 described a cluster of respondents placing high value on environmental concerns. This group did not rate higher in horticultural knowledge or practices, suggesting that strong environmental values did not translate into better horticultural practices or knowledge for respondents to this survey.
Figure 1.
Profile Plot Showing Scores on
Six Response Indices for Two Groups of Respondents to a Lawn Care
Survey
Demographic Factors Affecting Group Membership
The logistic regression (p < 0.0001, pseudo-R-square = 0.468) determined that significant factors favoring inclusion of respondents in Group 1, the high-environmental-valuing group, were sex (female), political identification (more liberal), and age (older). Significant factors, p-values, and exponentiated coefficient estimates are shown in Table 2. Factors that did not have a significant effect on group membership were income, education level, town of residence, size of lawn, and who maintains the lawn.
| Factor | Significance | Exponentiated coefficient | 95% confidence interval for exponentiated coefficient |
| Sex (female) | *** | 10.5 | 2.67-51.9 |
| Political identification (more liberal) (points, on a 5-point scale) | *** | 2.44 | 1.52-4.29 |
| Age (older) (age, in years) | * | 1.08 | 1.02-1.15 |
| Notes: Significance is indicated by: *, p < 0.05; ***, p < 0.001. Exponentiated coefficient indicates the factor of increase in the odds of belonging to the high-environmental-valuing group. Factors that did not have a significant effect on group membership were income, education level, town of residence, size of lawn, and who maintains the lawn. | |||
Significant factors were also highly influential on group membership. For example, the exponentiated coefficient for sex was 10.5, indicating that the odds of membership in Group 1 was 10.5 times as large for female respondents as male respondents for this model. Likewise, a single point increase on the 5-point political identification scale increased the odds of Group 1 membership by a factor of 2.44. It may not be the case that these same factors would determine membership in high-environmental-valuing groups in other populations, but it is clear from these results that demographic factors may be important in understanding those values of clientele that may be important in effecting behavior change. In this case, factors favoring membership in the high-environmental-valuing group were being female, older, or more politically liberal.
Conclusions
Because homeowners comprise a large clientele group, with usually a wide range of knowledge and values, assessing their values, goals, and background knowledge may be an important step in encouraging them to adopt better lawn care practices. As in previous surveys, the study reported here found that homeowners valued both environmental conservation and having attractive lawns. It is probable, then, that Extension education programs in this area should address both of these as management goals, as well as other goals homeowners may have such as saving money. While the study found that sex, political identification, and age influenced membership in the high-environmental-valuing group, it is not known if these would be important factors in similar group membership in other populations. In the case of the study reported here, factors favoring membership in the high-environmental-valuing group were being female, older, and more politically liberal.
Educators should be sensitive that demographic factors may influence the values held by different clientele sub-populations. Furthermore, in the case of these data, membership in the high-environmental-valuing group did not translate into better horticultural practices, suggesting that Extension educators may face challenges in motivating some clientele to adopt practices even when they already possess requisite attitudes or knowledge.
Acknowledgements
Funding and in-kind support for this project were provided by Rutgers Cooperative Extension Water Resources Program, New Jersey Department of Environmental Protection Division of Water Supply, and the U.S. Environmental Protection Agency Region 2 through the Water Conservation Program for New Jersey. All research conducted involving human subjects received federally approved Institutional Review Board approval.
References
Fraley, C., & Raftery, A. E. (2006). MCLUST version 3 for R: Normal Mixture Modeling and Model-based Clustering, Technical Report No. 504. Seattle, WA: University of Washington, Department of Statistics. Retrieved from: http://www.stat.washington.edu/fraley/mclust/tr504.pdf
Hefner, S. G., Robertson, C., Coulter, A., & Stevens, G. (2009). Engaging citizens to urban nutrient planning of lawns within a nutrient sensitive watershed. Journal of Extension [On-line], 47(4) Article 4IAW5. Available at: http://www.joe.org/joe/2009august/iw5.php
Mangiafico, S. S., Newman, J. P., Mochizuki, M. J., & Zurawski, D. (2008). Adoption of sustainable practices to protect and conserve water resources in container nurseries with greenhouse facilities. Acta Horticulturae 797, 367-372.
R Development Core Team (2010). R: A language and environment for statistical computing. Vienna, Austria: R Foundation for Statistical Computing. Retrieved from: http://www.R-project.org.
Sellmer, J. C., Ostiguy, N., Hoover, K. & Kelley, K. M. (2004). Assessing the integrated pest management practices of Pennsylvania nursery operations. HortScience 39 (2), 297-302.
Sewell, S., McCallister, D., Gaussoin, R., & Wortmann, C. (2010). Lawn management practices and perceptions of residents in 14 sandpit lakes of Nebraska. Journal of Extension [On-line], 48(2) Article 2RIB4. Available at: http://www.joe.org/joe/2010april/rb4.php