August 2012
|
August 2012 // Volume 50 // Number 4 // Research In Brief // v50-4rb6


Assessment of Iowa Soybean Growers for Insect Pest Management Practices
Abstract
In 2009, Iowa soybean growers were surveyed about current insect pest management practices. The purpose was to better understand how often growers were scouting and what they perceived as the primary pests in Iowa soybean. Soybean aphid is the primary pest throughout the state. There was a 1423% increase of insecticides applied to soybean since 2000. Respondents indicated they are regularly scouting for soybean insects to make treatment decisions. Iowa growers are getting pest management information via Extension and industry.
The soybean aphid is the most economically important soybean pest in the North Central Region (Ragsdale et al., 2007). This aphid is an invasive species first confirmed in North America in 2000 and now has the potential to infest 80% of the total U.S. crop each year because of its migratory potential and adaption to North American soybean (Venette & Ragsdale, 2004). During outbreaks, soybean aphid can cause more than 40% yield reduction in soybean (Ragsdale et al., 2007); however, the population dynamics of this aphid have been highly variable between fields and years. An economic threshold based on estimating aphids per plant has been determined to be 250 from bloom through seed set and is widely adopted throughout the North Central Region (Ragsdale et al., 2007). To protect yield and increase overall production profits, growers could incorporate regular scouting and make timely treatment decisions (Johnson et al., 2009). Alternatively, a binomial sequential sampling plan, Speed Scouting for Soybean Aphid, can make treatment decisions (Hodgson et al., 2007).
There were only occasional pest issues in soybean in the North Central Region before 2000 and less than 0.1% of soybean fields treated with insecticides (USDA-NASS). But the damage potential of soybean aphid has resulted in a 130-fold increase of insecticide applications in less than a decade (Ragsdale, Landis, Brodeur, Heimpel, & Desneux, 2011). Most commercial applications are based on the presence of aphids and are necessary to regulate outbreaks, but some are used in a prophylactic manner to reduce the risk of yield loss. Needless applications reduce overall profit, increase exposure to non-target organisms, and can accelerate genetic resistance to major insecticide classes (Pedigo & Rice, 2009).
Soybean pest management in the North Central Region has dramatically changed with the arrival of soybean aphid. Our objective was to evaluate Iowa soybean growers' current pest management practices and better understand how stakeholders are getting information. Our goal was to identify knowledge gaps in sustainable soybean management. We asked growers which specific soybean insects they encounter, how often they are sampling for pests, and how they receive information. The results of the study reported here will 1) help direct useful insect management extension programming in Iowa and 2) help to produce high-quality research that is directly applicable to soybean growers.
Methodology
The survey was developed and conducted by researchers at Iowa State University. Participants were recruited for the study through their membership in the Iowa Soybean Association. Every person who sells soybean in Iowa automatically contributes to the soybean check-off through the Iowa Soybean Association. The population of 4,900 members was mailed the survey on 7 April 2010. Members also received a return envelope and a letter inviting them to participate and informing them of the consent components.
Of those contacted, 918 responded between 12 April 2010 and 12 May 2010, resulting in an initial response rate of 18.7%. The response rate was disappointing but anticipated, given that the survey was mailed and the timing of distribution corresponded with growers preparing or planting crops. Of the 918 respondents, 13 simply noted that they were retired, and two more indicated that they were cash rent landowners. None of these 15 people responded to any questions, so their data were not included in the summary results. Useable surveys were received from 903 respondents, for an 18.5% response rate. Participants indicated what county they were associated with, and we grouped the 99 Iowa counties into nine regions (Table 1). Respondents were asked to provide information about the number of soybean acres they grew and treated for insects, what types of insects they encountered, and what scouting methods they preferred. The participants were also asked to rate how helpful various sources of information were for making insect management decisions.
| Region | Counties included | N | % |
| Overall | All | 903 | 100.0 |
| Northwest | Buena Vista, Cherokee, Clay, Dickinson, Emmet, Lyon, O'Brien, Osceola, Palo Alto, Plymouth, Pocahontas, Sioux | 139 | 15.9 |
| North Central | Butler, Cerro Gordo, Floyd, Franklin, Hancock, Humboldt, Kossuth, Mitchell, Winnebago, Worth, Wright, | 133 | 15.2 |
| Northeast | Allamakee, Black Hawk, Bremer, Buchanan, Chickasaw, Clayton, Delaware, Dubuque, Fayette, Howard, Winneshiek | 139 | 15.9 |
| West Central | Audubon, Calhoun, Carroll, Crawford, Greene, Guthrie, Harrison, Ida, Monona, Sac, Shelby, Woodbury | 79 | 9.0 |
| Central | Boone, Dallas, Grundy, Hamilton, Hardin, Jasper, Marshall, Polk, Poweshiek, Story, Tama, Webster | 153 | 17.5 |
| East Central | Benton, Cedar, Clinton, Iowa, Jackson, Johnson, Jones, Linn, Muscatine, Scott | 112 | 12.8 |
| Southwest | Adair, Adams, Cass, Fremont, Mills, Montgomery, Page, Pottawattamie, Taylor | 43 | 4.9 |
| South Central | Appanoose, Clarke, Decatur, Lucas, Madison, Marion, Monroe, Ringgold, Union, Warren, Wayne | 23 | 2.6 |
| Southeast | Davis, Des Moines, Henry, Jefferson, Keokuk, Lee, Louisa, Mahaska, Van Buren, Wapello, Washington | 53 | 6.1 |
Findings
Insecticide Use
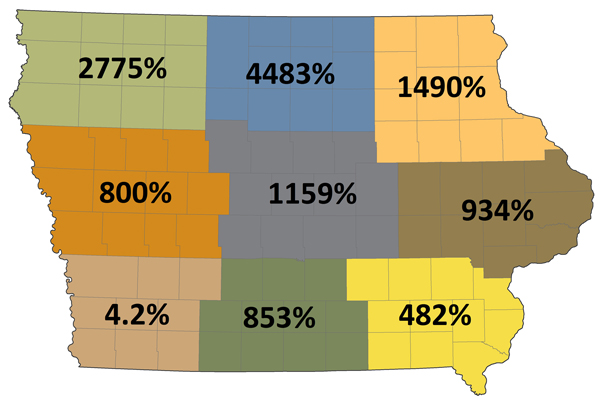
In Iowa, there were 1,100,000 fewer acres of soybean planted in 2009 (9,600,000) than in 2000 (USDA-NASS). Participants represent 405,461 soybean acres (Table 2), or about 24% of the total acres grown in Iowa. Between 2000 and 2009, they reported that, in sum, foliar insecticide use rose exponentially, particularly in North Central and Northwestern Iowa (Figure 1). Soybean aphid populations are generally more abundant and economically important in northern Iowa, and the increased use of insecticides reflects aphid pressure in those geographic regions. Respondents indicated that in 2000, just 19,457 acres were treated with insecticides, compared with 296,381 acres in 2009—a dramatic statewide 1,423% increase. Insecticidal seed treatments were not commonly used before 2000 because insect pressure was low, but approximately 73% of the soybean planted in Iowa had an insecticidal seed treatment in 2009 (Table 3).
In 2010, host plant resistance for soybean aphid became commercially available. We were curious if growers had heard of this new management tool and would be willing to incorporate it into their production. Only 42.8% of respondents indicated they would be willing to incorporate host plant resistance to regulate soybean aphid, and nearly 20% said they have not heard of this new management tool. The survey did not ask them why they would not be willing to use host plant resistance.
| Counties | N | Mean ± SEM1 | Range | Sum |
| Overall | 889 | 456.09 ± 16.72 | 0 - 10,000 | 405,461 |
| Northwest | 139 | 435.64 ± 28.99 | 0 - 2,250 | 60,554 |
| North Central | 131 | 436.21 ± 25.13 | 0 - 1,200 | 57,143 |
| Northeast | 138 | 444.05 ± 76.47 | 4 - 10,000 | 61,278 |
| West Central | 77 | 521.90 ± 60.50 | 60 - 5,000 | 40,186 |
| Central | 151 | 529.36 ± 34.50 | 0 - 2,683 | 79,934 |
| East Central | 112 | 418.48 ± 34.35 | 41 - 2,700 | 46,870 |
| Southwest | 42 | 500.81 ± 61.36 | 26 - 1,650 | 21,034 |
| South Central | 22 | 540.77 ± 128.50 | 42 - 2,631 | 11,897 |
| Southeast | 52 | 334.81 ± 30.26 | 0 - 1,200 | 17,410 |
| 1 Standard error of the mean. | ||||
Figure 1.
Regional Percent Increase of Soybean Acres Exposed to Foliar Insecticides in Iowa from 2000 to 2009
| Counties | N | Mean ± SEM1 | Range | Sum |
| Overall | 875 | 247.27 ± 13.20 | 0 - 6,500 | 216,361 |
| Northwest | 133 | 238.51 ± 28.49 | 0 - 1,900 | 31,722 |
| North Central | 132 | 179.72 ± 21.97 | 0 - 1,093 | 23,723 |
| Northeast | 136 | 263.14 ± 55.31 | 0 - 6,500 | 35,787 |
| West Central | 76 | 289.82 ± 30.78 | 0 - 1,000 | 22,026 |
| Central | 148 | 340.72 ± 30.62 | 0 - 2,000 | 50,427 |
| East Central | 109 | 200.36 ± 27.37 | 0 - 1,500 | 21,839 |
| Southwest | 42 | 287.90 ± 54.50 | 0 - 1,500 | 12,092 |
| South Central | 23 | 363.17 ± 129.68 | 0 - 2,631 | 8,353 |
| Southeast | 51 | 133.78 ± 24.89 | 0 - 620 | 6,823 |
| 1 Standard error of the mean. | ||||
Primary Pest
Soybean aphid was the dominant pest of Iowa soybean in 2009. Nearly 94% of growers surveyed said soybean aphid was their main pest, and nearly 98% had encountered soybean aphid (Table 4). Only 5% said bean leaf beetle was their primary pest (mainly South Central and Southeast Iowa), but 63% had encountered this species (Table 4). Several other pests were identified as being encountered in soybean, including spider mites, Japanese beetle, stink bugs, and potato leafhopper.
| Overall counties | Primary pest | % Primary pest | Encountered | % Encountered |
| Soybean aphid | 625 | 93.8 | 864 | 97.6 |
| Bean leaf beetle | 33 | 5.0 | 557 | 63.0 |
| Stink bugs | 0 | 0.0 | 64 | 7.2 |
| Japanese beetle | 4 | 0.6 | 158 | 17.9 |
| Potato leafhopper | 1 | 0.2 | 62 | 7.0 |
| Thrips | 0 | 0.0 | 8 | 0.9 |
| Spider mites | 2 | 0.3 | 256 | 28.9 |
| Caterpillars | 0 | 0.0 | 25 | 2.9 |
| Other1 | 1 | 0.2 | 20 | 2.3 |
| 1 Others included grasshoppers (n=10), soybean cyst nematode (n=6), Northern corn rootworm (n=2), and Asian beetles (n=2). | ||||
Who Scouts Fields
A majority of survey respondents (55%) indicated scouting their soybean fields themselves, while 44% said an agribusiness entity scouted their fields (Table 5). Nearly one third of participants reported a professional crop consultant looked for insects (31.7%). Some respondents also noted they received scouting help from family (8.5%), or friends (3.6%).
| Counties | Agribusiness N (%) | Consultants N (%) | Myself N (%) | Friends N (%) | Family N (%) | Other N (%) |
| Overall | 388 (43.9) | 280 (31.7) | 489 (55.4) | 27 (3.6) | 75 (8.5) | 39 (4.4) |
Scouting Frequency
Nearly 60% of respondents said their fields are scouted for insects at least once a week (Table 6). More than one-third (37%) reported scouting fields at least once every 2 or 3 weeks. Fewer than 4% of participants scout their fields less than once per month. The data also indicate that fields in the south (Southwest, South Central, and Southeast) are scouted less often than those fields in other parts of the state. Scouting variability throughout the state is likely due to a result of historical pest pressure (i.e., more persistent pests likely to cause economic damage in northern Iowa).
Nearly half (44%) of growers who responded said they had not heard of the Speed Scouting for Soybean Aphid method for making treatment decisions, contrasted with 17% who said they use it regularly. Of the remainder, 22% said they had heard of it but not tried it; 14% said they used the method occasionally; and just 3 % said they had tried the method but decided not to use it. Participants who do not prefer to use Speed Scouting for Soybean Aphid indicated they do not believe it is an accurate decision tool or aggressive enough for protecting yield, and the plan takes too long to make a decision.
| Counties | At least once per week N (%) | At least every two weeks N (%) | At least every three weeks N (%) | Once per month N (%) | Once during the summer N (%) | Never N (%) |
| Overall | 518 (58.9) | 303 (34.4) | 27 (3.1) | 23 (2.6) | 8 (0.9) | 1 (0.1) |
Information Resources
There are several coordinated Extension programs for field crops at Iowa State University, including an online newsletter (Integrated Crop Management News) that is updated throughout the year, an annual meeting (Integrated Crop Management Conference) for professionals, and statewide workshops (Crop Advantage Series) for growers during the winter. These programs include all aspects of successful field crop production, including fertility, breeding, pest management, and economics. More information about these Extension programs can be found at <www.aep.iastate.edu>. More than half (63%) of respondents indicated using ICM News, and 75% found it mostly or very helpful (Table 7). Over 90% of respondents used agribusiness to get pest management information and 89% found it mostly or very helpful.
| Counties | N Used | % Used | % Not at all helpful | % A little helpful | % Mostly helpful | % Very helpful |
| ICM News | 545 | 63.2 | 0.0 | 25.1 | 47.2 | 27.5 |
| ICM Conference | 234 | 27.2 | 3.0 | 38.9 | 39.3 | 18.8 |
| CAS | 357 | 41.5 | 3.1 | 26.6 | 45.1 | 25.2 |
| ISU personnel | 506 | 58.6 | 0.1 | 26.5 | 46.8 | 25.7 |
| Agribusiness | 782 | 90.5 | 0.3 | 10.6 | 49.0 | 40.0 |
| Field days | 544 | 63.1 | 4.0 | 40.3 | 43.9 | 11.8 |
| Outside Iowa | 238 | 27.6 | 17.2 | 49.2 | 28.6 | 5.0 |
| Websites | 497 | 57.8 | 1.8 | 34.4 | 46.7 | 17.1 |
| Family, Friends | 689 | 79.9 | 3.5 | 37.2 | 44.7 | 14.7 |
| Other | 46 | 5.55 | 2.2 | 6.5 | 19.6 | 71.7 |
Implications
Detection of soybean aphid in Iowa in 2000 had a dramatic change in soybean pest management. The potential for yield loss has forced growers to increase their overall production costs (e.g., scouting and applying insecticides) to protect yield. Most participants indicated they gathered information from different resources and found Extension programming useful. Future research and Extension efforts should continue to promote sustainable tactics like host plant resistance, scouting and timely insecticide applications.
Acknowledgments
Authors would like to thank the Iowa Soybean Association and the soybean check-off for survey funding and distribution.
References
Hodgson, E. W., McCornack, B. P., Koch, K. A., Ragsdale, D. W., Johnson, K. D., O'Neal, M. E., Cullen, E. M., Kraiss, H. J., DiFonzo, C. D., Jewett, M., & Behnken, L. M. (2007.) Field validation of Speed Scouting for Soybean Aphid. Crop Management. doi:10.1094/CM-2007-0511-01-RS.
Johnson, K. D., O'Neal, M. E., Ragsdale, D. W., Potter, B. E., DiFonzo, C. D., Swinton, S. M., & Hodgson, E. W. (2009). Probability of cost-effective management of soybean aphid (Hemiptera: Aphididae) in North America. Journal of Economic Entomology 102: 2101-2108.
Pedigo, L. P, & Rice, M. E. (2008). Entomology and pest management, 6th ed. Prentice Hall, Upper Saddle River, New Jersey.
Ragsdale, D. W., McCornack, B. P., Venette, R. C., Hodgson, E. W., Potter, B. D., MacRae, I. V., O'Neal, M. E., Johnson, K. D., O'Neil, R. J., DiFonzo, C. D., Hunt, T. E., Glogoza, P., & Cullen, E. M. (2007). Economic threshold for soybean aphid (Hemiptera: Aphididae). Journal of Economic Entomology 100: 1258-1267.
Ragsdale, D. W., Landis, D. A., Brodeur, J., Heimpel, G. E., & Desneux, N. (2011). Ecology and management of the soybean aphid in North America. Annual Review of Entomology 56: 375-399.
United States Department of Agriculture - National Agricultural Statistics Service. Retrieved from: www.nass.usda.gov/
Venette, R. C., & Ragsdale, D. W. (2004). Assessing the invasion by soybean aphid (Homoptera: Aphididae): Where will it end? Annals of the Entomological Society of America 97: 219-226.