August 2012
|
August 2012 // Volume 50 // Number 4 // Research In Brief // v50-4rb2


Using Common Evaluation Instruments Across Multi-State Community Programs: A Pilot Study
Abstract
In times of diminishing resources to support community programs, it is critical that Extension make every effort to show impact as collectively as possible for the variety of programs being delivered in individual counties and communities. The pilot study reported here (funded by CYFAR, NIFA, USDA award #2008-41520-04810), focused on outcomes in youth citizenship programs in four states. Key factors to consider in the selection of common instruments include length, scope, and validation of instruments. The importance of dosage, specifically intensity and duration, are highlighted in relation to program outcomes.
Introduction
Extension professionals are often called upon to evaluate the effectiveness of their community programs in producing measurable change in participants. The challenge for many Extension programs is assessing impact of programs that may vary somewhat in content and delivery method, but possess some of the same overall goals. To assess the collective impact of statewide, regional, or national programs, evaluation tools must possess common elements and be comparable in their measurement of various outcomes. The current study evaluated the outcomes of seven programs across the United States in the domains of parenting and youth citizenship through the Children, Youth, and Families At Risk (CYFAR) Program: Sustainable Community Projects (SCP) funded by USDA National Institute of Food and Agriculture (NIFA Award #2008-41520-04810). Results of the pilot study and implications for Extension are discussed.
Rationale for Using Common Measures
Common measures are the standardization of assessment instruments across various community programs to evaluate the overall impact and effectiveness of topically similar community programs. Common evaluation measurement can assist in cross-program comparison, allowing for various programs to be examined on similar outcomes and outputs. Using common measurement instruments across community programs to assess outcomes has been gaining support in an attempt to keep outcome reports efficient and focused (Flynn & Hodgkinson, 2001). In addition, the use of common measures allows for increased accountability between program providers and their funders (Roucan-Kane, 2008; Adler-Baeder, Kerpelman, Griffin, & Schramm, 2010). There are several motivations to use common measures when evaluating programs:
- To secure and maintain scarce or limited funding from various resources (Roucan-Kane, 2008; Adler-Baeder et al., 2010);
- To develop or impact legislation or policy;
- To increase accountability to funders and participants;
- To assist in the improvement of decision making tasks regarding program development, implementation, and effectiveness (Stone & Cutcher-Gershenfeld, 2001); and
- To improve the quality of program evaluations by using tested reliable and valid instruments.
The purpose of the Common Measure Pilot study was to assess the extent to which CYFAR SCP sites were willing and able to use common evaluation instruments, and to obtain data from CYFAR SCP participants to be able to assess the collective impact of programs across the country.
Selecting Participants and Tools to Conduct This Common Measures Evaluation
In 2005, the CYFAR Sustainable Communities Evaluation Task Force was formed to assess the degree to which projects were achieving their intended outcomes and to gauge the impact that projects were having on the status of children, youth, and families across the United States. A performance-monitoring framework was developed to track progress toward global indicators specified for each outcome cluster. The initial clusters included the following outcome areas: youth citizenship, parenting, healthy lifestyles, workforce preparation, and literacy and communication. In addition, task force members developed global indicators, which were aligned with each outcome cluster.
While outcome clusters and global indicators provided a first step towards gauging the impact of CYFAR projects across the country, there were substantial limitations inherent in this method. The global indicators continued to be measured using a variety of methods and instruments, which inhibited the task force from making any conclusive judgments concerning the impact projects were having collectively. A new task force was formed in 2008 and charged with conducting a pilot study to determine the extent to which CYFAR projects could use common evaluation instruments as part of their evaluation efforts. The task force decided to focus on two cluster areas: parenting and youth citizenship.
To identify the common measures to be used in the pilot study, a literature review was conducted of evaluation tools in the area of parenting and youth citizenship. Measures were screened based on length, content, and psychometric properties. The goal was to select measures that were short in length (approximately 10-20 items), broad enough to cover various domains in the areas of parenting and youth citizenship, and in possession of established and reliable psychometric properties (i.e., reliability, validity). The domain of parenting focused on parents' involvement and communication with their children (i.e., early childhood through adolescence), and the youth citizenship domain focused on areas such as connection to community, civic awareness, and civic efficacy. For the purposes of this article, we focus on the youth citizenship cluster.
Methods
Site partners were responsible for collecting data from their youth participants and submitting it to the evaluation team at the University of Arizona, where data were analyzed on an aggregate level. Aggregated results from the citizenship cluster across multiple sites are presented in this article.
Within citizenship programs participating in the pilot study, 116 participants completed a pre-survey, and of those, 75 participants completed a post-survey. Approximately 65% of participants completed both the pre- and post-test. Table 1 provides specific participant demographic information.
| Participant Sex | Age | Ethnicity | |
| Pre-Test (N=116) |
Male = 37%
Female = 63%
Total: 100% |
M = 15.15 years (SD = 1.8).
Range 12-18 years old
|
Asian = 11.8%
African American = 16.7%
Hispanic = 18.6% Multicultural = 10.8% Native American = 1% Pacific Islander = 1% White = 37.3% Other = 2.9% Total: 100% |
| Post-Test (N=75) |
Male = 24.4%
Female = 75.6%
Total: 100% |
M = 15.16 years (SD = 1.2).
Range 12-18 years old
|
Asian = 12.2%
African American = 22%
Hispanic = 9.8% Multicultural = 7.3% Native American = 0% Pacific Islander = 0% White = 46.3% Other = 2.4% Total: 100% |
For the youth citizenship cluster, the University of California Berkeley Civic Responsibility Survey (CRS) (Furco, Muller, & Ammon, 1998) was selected because it met the criteria for inclusion (short in length, broad in scope, and validated) and gained the greatest consensus for its use from task force members and site representatives. The CRS contains 10 items that are broad enough to tap into the domains of civic responsibility and were pertinent to the school-age and early adolescent programs participating in the pilot study.
The CRS has shown an average Cronbach's coefficient alpha-measure of internal consistency of α = .84 in prior usage (Cronbach, 1951; Santos, 1999). Three subscales are measured within the CRS, including: connection to community, civic awareness, and civic efficacy. The following psychometrics are based on pre-survey data from the current pilot study sample (n=116). Connection to community has four items, an example of which is "I know a lot of people in the community, and they know me," and shows good reliability (Cronbach's α = .81) (Cronbach, & Shavelson, 2004). Civic awareness has three items, an example is, "Doing something that helps others is important to me" and shows excellent reliability (α = .94). Civic efficacy is evidenced by three items, including "I feel like I can make a difference in the community" and it too has excellent reliability (α = .91) (Cronbach, & Shavelson, 2004).
While the authors acknowledge that modifying an established measure may alter the psychometric properties, the current study found that the psychometric properties of the modified instrument remain sound. Further examination of the two formats used (pre/post and retrospective) indicated that reliability between the two formats was comparable.
To accommodate the various program lengths, cycles, and frequencies, the CRS was offered in two formats: as a pre/post survey or in a retrospective format. Measures were made available in both paper/pencil format and online (accessed via Survey Monkey or through an Intranet website). Although the online formats were available, most sites elected to use a pencil/paper method and conducted data entry onsite. Each item had a 7-point Likert-type response scale (1 = strongly disagree, 2 = disagree, 3 = slightly disagree, 4 = neither agree nor disagree, 5 = slightly agree, 6 = agree, 7 = strongly agree). See Table 2 for a list of all items by sub-scale.
| Item Number | Sub-Scales | Time 1 Mean (SD) | Time 2 Mean (SD) |
| Connection to Community Sub-Scale | |||
| 1 | I feel like I am part of a community. | 5.2 (1.6) | 6.0 (1.0) |
| 2 | I pay attention to news events that affect the community. | 5.0 (1.5) | 5.6 (1.0) |
| 7 | I know a lot of people in the community and they know me. | 5.1 (1.6) | 5.6 (1.3) |
| 10 | Everyone should pay attention to the news, including myself. | 5.3 (1.7) | 6.0 (1.1) |
| Civic Awareness Sub-Scale | |||
| 3 | Doing something that helps others is important to me. | 5.7 (1.6) | 6.4 (0.7) |
| 4 | I like to help other people even if it is hard work. | 5.7 (1.5) | 6.2 (0.8) |
| 6 | Helping other people is something that everyone should do, including myself. | 6.0 (1.4) | 6.6 (0.7) |
| Civic Efficacy Sub-Scale | |||
| 5 | I know what I can do to help make the community a better place. | 5.0 (1.6) | 5.9 (0.9) |
| 8 | I feel like I can make a difference in the community. | 5.3 (1.6) | 6.0 (1.1) |
| 9 | I try to think of ways to help other people. | 5.3 (1.5) | 5.9 (0.9) |
Dosage, or the amount and frequency of the intervention received by participants, was evaluated through three survey items: length of each session, number of sessions attended monthly, and start and end date of program. Fiester, Simpkins, and Bouffard (2005) have operationalized dosage into the following constructs:
- Absolute attendance data, which includes a yes/no indicator of whether or not the individual participated/attended a program.
- Intensity data, which measures the amount of time an individual participates in a program over a specific time period. This is often measured as hours per day or week, days/sessions per week, or days/sessions in the past year.
- Duration data, which measures the length of participation over time—often measured in weeks, months, or years.
- Breadth data, which measures the range of programs and activities, participated in.
For the purposes of the pilot study reported here, data were collected on the intensity and duration of program participation.
Results of the Pilot Study
Results from the pilot study indicate that using common evaluation measures is a viable way to examine various programmatic impacts across CYFAR youth citizenship programs.
The first step in our analysis was to examine each sub-scale individually using paired-samples t-tests. Items in each sub-scale were summed and then averaged in order to retain the metric provided to participants. Results indicate that participants significantly increased their agreement with constructs at time 2 compared to time 1. (Table 3 shows the results for the three sub-scales.)
The mean shown in column 2 of the table indicates a unit change from the pre-test to the post-test. For instance, when examining the Connection to Community sub-scale, participants reported increases from pre-test to post-test (approximately from slightly agree to agree) for items such as "I feel like I am part of a community" and "I know a lot of people in the community and they know me." In addition, participants also showed significant increases in agreement on the Civic Awareness sub-scale. The Civic Awareness sub-scale is measured by items such as "Doing something that helps others is important to me" and "Helping other people is something that everyone should do, including myself." Participants in the study also showed significant increases on the Civic Efficacy sub-scale, which includes items such as "I know what I can do to help make the community a better place" and "I feel like I can make a difference in the community."
These results suggest that even when youth development programs have varying delivery methods, they appear to contribute in positive ways towards outcomes pertaining to civic responsibility. Youth participating in these programs report increases in connections to the community they live in, as well as awareness and efficacy about how they feel in advancing and understanding the needs of their community.
| Scale (Items) | Mean (SD) | df | t |
| Connection to Community (#1,2,7, 10) | .82 (1.2) | 66 | 5.7*** |
| Civic Awareness (#3,4,6) | .90 (1.4) | 67 | 5.8*** |
| Civic Efficacy (#5,8,9) | 1.3 (1.4) | 68 | 7.4*** |
| *** p < .0001 | |||
The second step in our analysis was to examine participant outcomes based on dosage as defined by Fiester et al. (2005). For the following analyses of duration data, we have divided the construct into categories of high, medium, and low. Duration in the project was measured by the number of months a youth participant was enrolled in the program. Given the number of participants who provided duration data (n = 53), fairly equal groupings were generated based on distribution percentiles. Participation in a program for 10 months or more was defined as High (21 participants), four to nine months as Medium (15 participants), and three months or fewer as Low (17 participants). Using these groupings, CRS sub-scales were examined to determine if program duration significantly impacted the outcomes at both pre- and post-test.
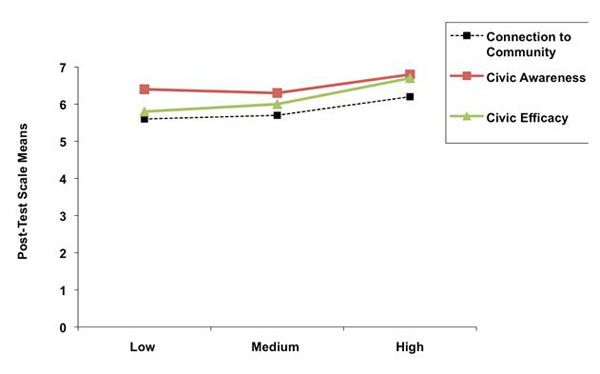
Results from the analysis of variance (Table 4) show that duration does indeed make a difference in the amount of change participants experience, such that, for most, longer duration in a program resulted in greater change in the outcomes examined. Results indicate that although the groups do not significantly differ at pre-test, duration does impact results on all three sub-scales at post-test. For the connection to community sub-scale, post-test results indicate that there is a significant difference (p < .01) between low and high groups such that participants who have been in the program for 10 months or longer show the greatest increase on scale items compared to medium and low groups. Additionally, on the civic awareness subscale, outcome change did significantly differ by duration; however the results suggest that high program duration (i.e., 10+ months) significantly differs from both the low duration and medium duration groups (Figure 1). Results suggest that not only does program content impact participant learning, but that the duration of the program may be an important factor to consider when evaluating change in specific outcomes over time in an evaluation framework.
| Scale | Time 1: F value | Time 1: Group Differences | Time 2: F value | Time 2: Group Differences | Direction of Differences (Figure 1) |
| Connection to Community | 2.2 | ns | 5.5** | Low & High p < .01 | Low < Medium < High |
| Civic Awareness | 2.3 | ns | 6.4** |
Low & High
p < .02
Medium & High
p < .008
|
Low > Medium < High |
| Civic Efficacy | 2.7 | ns | 7.8*** |
Low & High
p < .001
Medium & High
p < .03
|
Low < Medium < High |
|
Duration: Low = 3 month or less, Medium = 4 - 9 months, High = 10 months or more
* p < .05, ** p < .01, *** p < .001 |
|||||
Figure 1.
Program Time (Duration) by Post-Test Mean Scores
The final step in our analysis was to explore intensity of the intervention, as defined by Fiester et al. (2005). Intensity in the project was measured in two ways: length of sessions in hours and number of sessions per month. For these analyses we examined the correlation between the two intensity variables and the sub-scales. Length of sessions in hours was significantly and positively correlated to change over time in all three sub-scales: connection to community, civic awareness, and civic efficacy (Table 5). Number of sessions per month, however, was only related to connection to community and civic efficacy. These results suggest that program intensity is associated with program outcomes for these CYFAR programs, but the strength of that relationship appears to be stronger when it comes to the length of each session as opposed to the number of sessions held each month.
| Length of Session in Hours (Intensity) | Number of Sessions Per Month (Intensity) | Connection to Community: Change Scale | Civic Efficacy: Change Scale | Civic Awareness: Change Scale | |
| Length of Session in Hours (Intensity) | 1 | a | .53** | .61** | .69** |
| Number of Sessions Per Month (Intensity) | ___ | 1 | .31* | .28* | .15 |
| Connection to Community: Change Scale | ___ | ___ | 1 | .79** | .81** |
| Civic Efficacy: Change Scale | ___ | ___ | ___ | 1 | .84** |
| Civic Awareness: Change Scale | ___ | ___ | ___ | ___ | 1 |
|
a: correlation cannot be computed because one or more of the variables is constant.
* p < .05, ** p < .01 |
|||||
Implications for Extension and Using Common Measures
In times of diminishing resources to support community programs, it is critical that Extension make every effort to show impact as collectively as possible for the variety of programs being delivered in individual counties and communities. While these results are limited to current CYFAR programs, the pilot study demonstrated that common measures can be used successfully across programs, even when those programs vary somewhat in content and delivery method. Several lessons were learned about the use of common measures, including that:
- Dosage (i.e., the amount and frequency) of the intervention be assessed at all measurement points;
- Measurement tools be valid, reliable, and concise to minimize participant burden;
- Language used meets the needs of a wide range of target audiences in terms of reading level and fluency.
In consideration of future steps, CYFAR, through Children, Youth, and Families Education and Research Network (CYFERnet), is developing tools to assist future grantees in the use of common measures based on outcome indicators in various core competencies such as youth leadership, science and technology, nutrition, parenting, physical activities, and workforce preparation.
References
Adler-Baeder, F., Kerpelman, J., Griffin, M. M., & Schramm, D. G. (2010). Evaluating multiple prevention programs: Methods, results, and lessons learned. Journal of Extension [On-line], 48(6) Article 6FEA1. Available at: https://www.joe.org/joe/2010december/a1.php
Cronbach, L .J. (1951). Coefficient alpha and the internal structure of tests. Psychometrika, 16(3), 297-334.
Cronbach, L. J., & Shavelson, R. J. (2004). My current thoughts on coefficient alpha and successor procedures. Educational and Psychological Measurement, 64(3), 391-418.
Fiester, L. M., Simpkins, S. D., & Bouffard, S. M. (2005). Measuring attendance in out-of-school. time programs. In G.G. Noam (Ed.), New Directions for Youth Development, 105, 91-107. Hoboken, NJ: Wiley
Flynn, P., & Hodgkinson, V. A. (2001). Measuring the impact of the nonprofit sector. New York: Kluwer Academic/Plenum Publishers.
Furco, A., Muller, P., & Ammon, M. S. (1998). The civic responsibility survey. Developed at the Service-Learning Research & Development Center, University of California, Berkeley.
Roucan-Kane, M. (2008). Key facts and key resources for program evaluation. Journal of Extension [On-line], 46(1) Article 1TOT2. Available at: https://www.joe.org/joe/2008february/tt2.php
Santos, J. R. A. (1999). Cronbach's Alpha: A tool for assessing reliability of scales. Journal of Extension [On-line], 37(2). Article 2TOT3. Available at https://www.joe.org/joe/1999april/tt3.php
Stone, M. M., & Cutcher-Gershenfeld, S. (2001). Challenges of measuring performance in nonprofit organizations. In P. Flynn & V. A. Hodgkinson (Eds.), Measuring the impact of the nonprofit sector (pp. 33-52). New York: Kluwer Academic/Plenum Publishers.