December 2011
|
December 2011 // Volume 49 // Number 6 // Tools of the Trade // v49-6tt7


An Automated Data Analysis Tool for Livestock Market Data
Abstract
This article describes an automated data analysis tool that allows Oklahoma Cooperative Extension Service educators to disseminate results in a timely manner. Primary data collected at Oklahoma Quality Beef Network (OQBN) certified calf auctions across the state results in a large amount of data per sale site. Sale summaries for an individual sale need to be quickly dispensed to program coordinators, auction barn owners, and program participants. Data entered into a Microsoft Excel spreadsheet at sales is summarized using Excel database commands. A link to Microsoft Publisher then generates the sale summary for an individual OQBN sale.
Introduction
In 2000, Oklahoma State University's Cooperative Extension Service, in cooperation with the Oklahoma Cattlemen's Association, launched the Oklahoma Quality Beef Network (OQBN) as an avenue to increase the value of Oklahoma calves. OQBN is a third-party health management certification program (VAC-45) for calves that meet program specifications for weaning, vaccinations, and other health management practices. Together, these practices constitute preconditioning. OQBN was re-launched in 2009 as a brand neutral preconditioning program allowing dual certification with industry VAC-45 certification programs. Program objectives are two-fold: (1) to create producer access to value added markets by hosting OQBN certified sales at local livestock markets and (2) to educate Oklahoma cow/calf producers about existing value added marketing activities to encourage participation.
OQBN sales are facilitated through local auction barns as livestock market owners express interest in hosting an OQBN sale. Sales are typically held in conjunction with regular feeder cattle sales, though separate sale dates are sometimes arranged. Sale prices and cattle characteristics are collected on each lot of cattle sold at every sale. The information the data holds is important to livestock market owners, producers who participate in the sales, the interdisciplinary Extension team, and other interested parties. Sale summaries need to be produced quickly to maintain the efficiency and credibility of the Extension program.
As OQBN grows, timely dispensation of sale results between Extension personnel and their target audience has become increasingly difficult. Mallilo and Millar (1992) found that information exchange and dissemination are key factors that affect program success. Further, Vergot, Israel, and Mayo (2005) found that cattlemen listed Extension personnel as their second preferred source of information, behind other cattlemen. Additionally, Extension publications ranked first and third as preferred channels of information. Rapid dissemination of information allows Extension personnel to capture the program's fullest potential for educational opportunities with producers and other participants. As a remedy, an Excel spreadsheet coupled with a Microsoft Publisher template facilitates rapid data analysis for individual sales in a usable form that is easily distributed to Extension personnel and livestock market owners within days of a particular sale. That information flow continues to cattleman who participated in the OQBN sale, to those contemplating future participation, and to industry professionals, such as bankers or veterinarians, who are interested in the benefits to producers. This connection between biological practices and economic benefits is critical in encouraging adoption of new technology or management practices (Barao, 1992).
The number of value-added calf programs has grown rapidly, with state- and Extension-certified programs competing alongside industry certified programs (e.g., Montana, Kentucky, West Virginia, Iowa). Extension personnel in other states, such as Wisconsin, are analyzing livestock market data to assess the usefulness of implementing a statewide preconditioning program (Halfman, Lehmkuhler, & Cox, 2009). This template could be useful to program administrators who need quick analysis of auction data on the value of different management practices or to individual livestock auction barns who conduct value-added sales and want a quick assessment of impact for producers who consign their cattle. The template is easily modifiable to fit the specific data collected. Extension personnel could assist auction barn owners in learning how to use the benefits of this template.
Features
The data analysis tool produces sale summaries from data collected at OQBN hosted sales. Raw sale day data is collected via laptop computers in an Excel spreadsheet. A unique sale identification number is keyed into the spreadsheet's data analysis page to generate the sale summary. The summary is based on a template similar to USDA's Agricultural Marketing Service market report and reports calf prices by gender, by weight, and by management practice. This format facilitates producer understanding of the summary because many producers are familiar with this format. Prices are calculated as weighted averages based on lot size and the characteristics specified below. Minimum and maximum prices for each weight category are also reported. Figure 1 illustrates the process of sorting data to generate price reports.
Figure 1.
Breakdown Process of Price Report
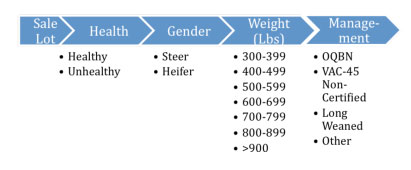
For appropriate comparison, visibly unhealthy cattle are excluded. Data are then sorted by the gender because a price differential generally exists between steers and heifers. Finally, data are sorted by weight and by management practice. This allows weighted average prices to be reported for different bundles of management practices. Microsoft Excel's database commands are used as the sorting mechanism. As shown in Figure 2, each sale is coded with a unique sale identification number. Those cells are linked to a single cell where the sale identification code is easily changed to create the summary for any sale.
Figure 2.
Excel Database Command Code Example
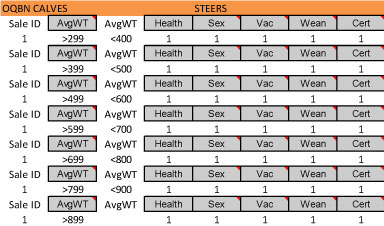
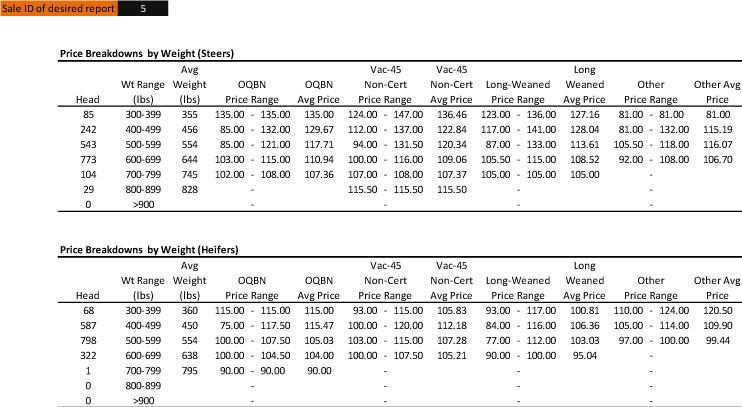
Figure 3 shows the price summary in Excel, which mimics weekly price reports from Agricultural Marketing Service. This format is one that producers, Extension personnel, and other interested parties are accustomed to interpreting. A link to Microsoft Publisher generates the sale summary with specific sale date and location in a distributable form for an individual OQBN sale.
Figure 3.
Price Summary Template in Excel
Summary
Cattle producers use sale summaries to evaluate program validity and whether OQBN participation resulted in premiums. Previous research done in Iowa found evidence of premiums ranging anywhere from $1.30/cwt (Lawrence & Yeboah, 2002) to $6.12/cwt (Bulut & Lawrence, 2007). Avent, Ward, and Lalman (2004) concluded existence of a $3.30/cwt premium for Vac-45 cattle at a Joplin, Missouri market. The sale summaries enable Extension personnel and participants to quickly assess whether evidence of an OQBN premium at a particular sale exists. This information is used to educate non-participating producers about the opportunities offered by participation in OQBN.
As Extension programs grow and target audiences become larger, Extension educators are faced with the task of quick and precise data analysis and dissemination. The data analysis tool discussed here facilitates rapid evaluation of large amounts of primary livestock auction data so that the value of the Extension program (Oklahoma Quality Beef Network) can be communicated easily to appropriate audiences. The tool is easily modified to fit specific informational needs. To access the tool and template, contact kellie.raper@okstate.edu.
References
Avent, R. K., Ward, C. E., & Lalman, D. L. (2004). Market valuation of preconditioning feeder calves. Journal of Agricultural and Applied Economics, 36(01), 173-183.
Barao, S. M. (1992). Behavioral aspects of technology adoption. Journal of Extension [On-line], 30(2) Article 2FEA4. Available at: http://www.joe.org/joe/1992summer/a4.php
Bulut, H., & Lawrence, J. D. (2007). The value of third-party certification of preconditioning claims at Iowa feeder cattle auctions. Journal of Agricultural and Applied Economics, 39(03), 625-640.
Halfman, B., Lehmkuhler, J. W., & Cox, T. (2009). Factors affecting Wisconsin feeder calf prices at a local livestock market. Journal of Extension [On-line], 47(6) Article 6RIB7. Available at: http://www.joe.org/joe/2009december/rb7.php
Lawrence, J., & Yeboah, G. (2002). Estimating the value of source verification of feeder cattle. Journal of Agribusiness, 20(2), 117-130.
Mallilo, A. T., & Millar, P. A. (1992). Impacts on program success. Journal of Extension [On-line], 30(2) Article 2RIB2. Available at: http://www.joe.org/joe/1992summer/rb2.php.
Vergot P., III, Israel, G., & Mayo, D. E. (2005). Sources and channels of information used by beef cattle producers in 12 counties of the Northwest Florida Extension District. Journal of Extension [On-line], 43(2) Article 2RIB6. Available at: http://www.joe.org/joe/2005april/rb6.php