December 2011
|
December 2011 // Volume 49 // Number 6 // Feature // v49-6a9


Mapping Extension's Networks: Using Social Network Analysis to Explore Extension's Outreach
Abstract
The University of Minnesota Extension conducted a social network analysis (SNA) to examine its outreach to organizations external to the University of Minnesota. The study found that its outreach network was both broad in its reach and strong in its connections. The study found that SNA offers a unique method for describing and measuring Extension outreach and that SNA can be effectively used to examine internal patterns around outreach while informing strategies toward improved alignment and greater leveraging of institutional knowledge. The findings indicate that SNA has great potential for improving reporting, developing internal collaboration, and conducting system-wide impact evaluations.
Introduction
Extension professionals deliver information through educational offerings as well as through their relationships with partners and other social networks. At the heart of University of Minnesota Extension's mission to "take University knowledge out to the community to improve the lives of citizens" are the relationships developed between Extension professionals and community organizations. While there are a myriad of examples of quality evaluations of Extension educational offerings, few formal evaluations have explored Extension-wide connections or networks with community organizations.
A review of recently published articles indicates that social networks have been explored to some extent in Extension. These studies explored links to specific types of organizations such as the work by Prins and Ewert (2002) that examined Extension's connections to faith based organizations. The work by Adedokun and Balschweid (2009) explored specific programs in 4-H regarding the social networks of youth. More often, Extension professionals have highlighted social networks as a critical factor in obtaining buy-in at the community level, improving community outcomes, and building social networks among community members as an important program strategy (e.g., Adedokun & Balschweid, 2009; Cartwright & Gallagher, 2002; Contreras, 2008; Fritz, Boren, Trudeau, & Wheeler, 2007; Ricketts & Place, 2009; Robinson & Meikle-Yaw, 2007).
Networks play an essential role in how and where Extension carries out its outreach strategies. Networks reflect an organization's outreach structure, types of connections, and the symbiotic "communities" through which participants influence each other. The University of Minnesota Extension (U of M Extension) recognized a need to better understand its connections to organizations across the state. Understanding its connections became even more important as stakeholders questioned whether its reorganization into a regional system has resulted in losses of local community-based partners (Morse and Ahmed, 2007). A U of M Extension study was conducted in 2008 to explore the following questions: What organizations does U of M Extension support? What does this outreach look like? What do these connections look like across the state, in different regions, or by major program areas? This article reports on the process, some of the results, and implications of U of M Extension's Mapping Extension Networks study.
Method
Social Network Analysis (SNA) methodology was used to assess U of M Extension's outreach to external organizations. Due to the size and complexity of the organization, a Web-based survey tool was selected as the most appropriate and efficient way to collect data. As preparation for the study, a search for current literature on SNA and organization networks was conducted. In addition, two experts in the field of SNA were consulted, Dr. David Knoke, a professor of sociology at the University of Minnesota and an internationally-known expert in Social Network Analysis with organizations (Knoke, 2008; Andrews & Knoke, 1999), and MaryAnn Durland, a prominent expert in the use of SNA for evaluation purposes (Durland & Fredericks, 2006). Below are some key features of social network analysis that influenced the design of the study.
- The type of network analysis that Extension was pursuing is known as a "two-mode" or "affiliation" analysis, which emphasizes the relationships between actors (in this case, Extension staff) and external organizations or events. This type of network study differs from the more common "single mode" form of analysis that examines mutual connections among a group of individuals, such as co-workers or students in a school.
- It is imperative for network analyses to obtain as close to full participation as possible (a minimum of 82% response rate). Network surveys cannot rely on sampling. To get full participation, the evaluation team held meetings with communications staff, program leaders, associate deans, and the dean. As a result, support was generated, and a clear communications plan for the data collection process was developed. All Extension staff members, including civil service and part-time, were included.
- Because participants would often enter information on more than one organizational connection, the survey needed to be short. This brevity was supported by the fact that SNA is often used to measure a single type of relationship.
- Criteria for the inclusion of an
organization into the study needed to be concrete. The evaluation
team created the following parameters for inclusion:
- The organization must be external to the University of Minnesota.
- The staff member must have directly contributed to the organization at least 8 hours of their work time during the September 2007 through August 2008 period. Contributions could include phone conversations, e-mail communications, in-person contact, and other forms of direct effort.
- Contributions to the external organization must have been part of U of M Extension work.
Three measures of each organizational connection were collected: 1) depth of connections, 2) who initiated the connection, and 3) the perceived importance of Extension's contribution to the organization. The full survey can be found at <https://fdsurveys.extension.umn.edu/rws4.pl?FORM=MappingExtensionNetworks>.
A Network Preparation Sheet was designed to assist staff in managing the lists of organizations they would be entering into the survey. These sheets encouraged staff to look through their sent mail, calendars, and other communications to enhance their recall. The Preparation Sheet can be found at <https://netfiles.umn.edu/users/kcoffee/Network%20Preparation%20Form.pdf?uniq=-rpvtn5>.
The survey was conducted during a 3-week period in August and September of 2008. Web-based survey software for data collection was used, with the link to the survey pasted into email communications. Towards the end of this period, reminder emails were sent to staff members who had not responded to the survey. A second set of reminder emails (Dillman, 2000) was sent at the conclusion of the data entry period. More reminders were sent to non-responders as the deadline approached. The need for full participation was reinforced by organizational leaders.
After cleaning the data to remove connections that did not meet the three criteria, the team determined that a total of 784 Extension staff had completed the survey (see Table 1).
| Total Staff | Respondents | Number of staff who entered orgs. | Number of org. entries | Average number of orgs. entered (per staff entering orgs.) | Range of orgs. entered | |
| All | 817 | 784 (96%) | 561 (69%) | 3,958 | 7 | 1-39 |
| Ctr. for Fd., Ag. & Nat. Res. | 228 | 218 | 176 | 1,313 | 7 | 1-39 |
| Center for Family Dev. | 203 | 194 | 153 | 1,189 | 8 | 1-33 |
| Ctr. for Youth Dev. | 221 | 215 | 119 | 620 | 5 | 1-27 |
| Ctr. for Community Vitality | 63 | 59 | 55 | 409 | 7 | 1-30 |
| Central Extension Adm. | 102 | 98 | 59 | 427 | 7 | 1-36 |
Findings
In the following section we describe three strategies used to analyze and use the survey data. The first strategy was to describe the depth of relationships between Extension staff and external organizations using traditional statistical software (PASW, 2009). The second strategy was to map the outreach network(s) resulting from these relationships, using network mapping software UCINET 6 (Borgatti, Everett, & Freeman, 2002) and NetDraw 2 (Borgatti, 2002). This type of map produced important information related to the structure of this dimension of Extension's outreach, including the spread and clusters in outreach efforts. The third strategy was to map the structure of U of M Extension's relationships within thematic organization categories (38 categories). In addition to revealing stronger or weaker relationships between program areas and organization categories, this strategy revealed which organization categories and program areas were central (or peripheral) to the dimension of Extension's outreach being studied.
Depth of Relationships with Organizations
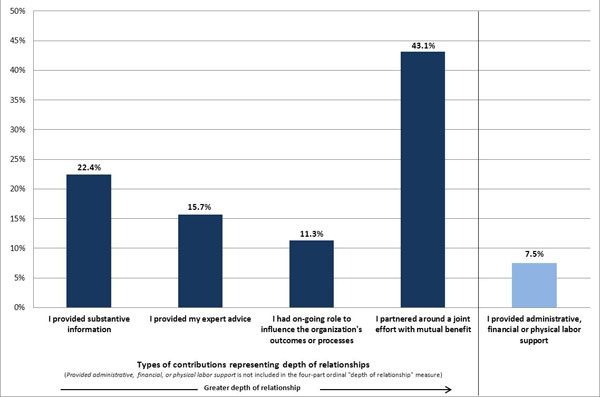
Respondents were asked to categorize the depth of relationship they had with each external organization they entered. The response categories were: 1) substantive information, 2) expert advice, 3) ongoing role to influence and organization's outcomes or processes, 4) partnership with organization, including joint effort and mutual benefits, and 5) financial or physical labor to an organization (see Figure 1). Categories one through four were designed as an ordinal variable representing levels of engagement, with the fourth category measuring the deepest type of external relationship and reflecting the University of Minnesota's definition of public engagement. In pilot tests we determined it was important to add the last category to attend to potential contributions by clerical and support staff. This category is separate from the ordinal variable associated with categories one through four.
The results indicated that U of M Extension's organizational outreach network was composed of all five types of relationships (Figure 1).
- The network was largely made up of Partnerships (43.1%), followed by Substantive information (22.4%), Expert advice (15.7%), and Ongoing role to influence organization's outcomes/processes (11.3%).
- A small portion of the network was Administrative, financial, or physical labor (7.5%).
It should be noted that it can be useful to assess each of these types of delivery as separate network units.
Figure 1.
Depth of U of M Extension's Relations with External Organizations
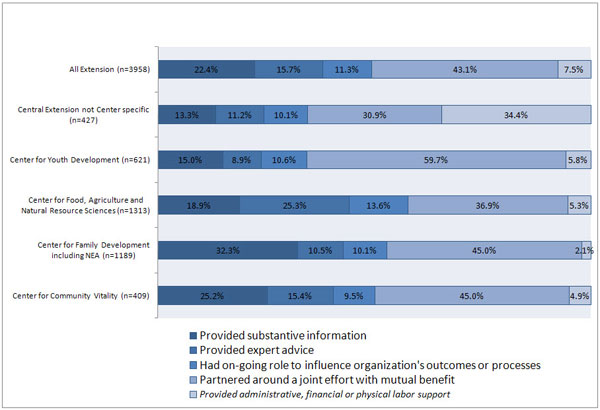
When looking at the network relationships at a more detailed center level (Figure 2), some of the findings that became clear were the following.
- Centers varied in the amount of delivery of each of the five types. However, generally, their patterns were similar.
- The largest type of outreach for all centers was partnerships.
- Central U of M Extension delivered substantially more administrative, financial or physical labor and substantially less partnerships than the program-based units.
Figure 2.
Depth of Communications, by Center and Extension-Wide
Mapping Program Relations to Organizations
The strength of network mapping is that it empirically reveals, in a way that no other approach can, the structure and quality of outreach networks. Furthermore, the method reveals programs that have more (and less) in common regarding outreach reflecting potentially undeveloped opportunities for staff or program collaboration, coordination, sharing, and learning that may lead to greater efficiency and better outreach performance.
In contrast to the linear representation of U of M Extension's network depicted in the bar graphs (Figures 1 and 2), a map of U of M Extension's outreach network—much like an X-ray—was generated using NetDraw's spring embedding algorithm (Figure 3). This algorithm positions points in the map relative to their connections, reflecting the relative proximity of program areas to each other and to organizations. The red diamonds in Figure 3 are organizations to which U of M Extension connects. The squares are U of M Extension program areas, colored by center association.
Figure 3.
Organizational Network, by Program Area
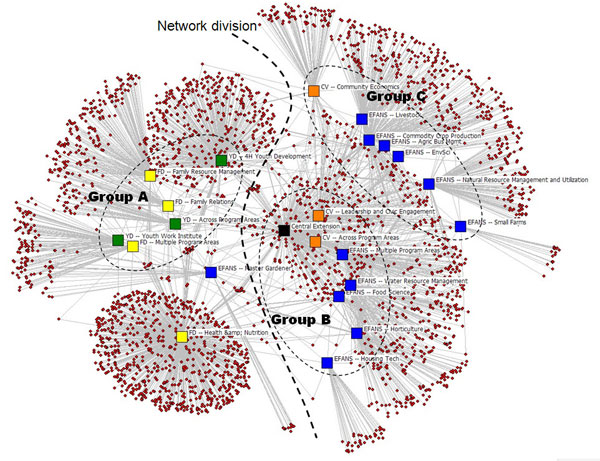
Some of what this map revealed:
- U of M Extension's outreach network had a widely distributed network. Program areas and organizations were widely spread out across the network.
- The wide distribution included segmented groups. The network was split in half, with Youth Development (YD) and Family Development (FD) on the left and the other program areas, including central Extension, on the right - representing a clear division.
- At a closer level, three clusters were evident, represented by Group A, Group B, and Group C. The program areas within each of these groups had more in common.
- Central Extension administration was positioned near the center of the network, as expected. It had a broader constituency than the other centers.
- The Master Gardener program was located closer to the centers of YD and FD. It had more in common with these centers than with its associated center.
- The Health and Nutrition program, with an enormous amount of organization connections, was by itself. It was largely isolated from the networks of the rest of U of M Extension.
To further clarify which Extension programs had the most in common within the outreach network, the map in Figure 3 was simplified. All organizations, except those connected to two or more programs, were removed. Using the spring embedded algorithm again, a new network that included common organizations and their connected programs only, was generated (Figure 4). Each red diamond (shared organization) represents a potential opportunity to leverage knowledge, contacts, and activity resources from within U of M Extension. Program clusters within this map represented common positioning within the outreach network, further identifying which programs may benefit from sharing.
Figure 4.
Common Organizational Network Between Program Areas
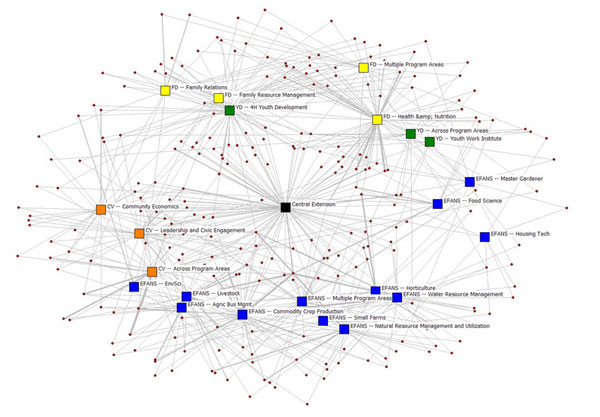
Maps like Figure 4 can also be defined by staff-to-staff connections, generating maps that show staff members who they are most closely associated with—tangible evidence around which to begin connecting with each other.
Mapping Programs with Organization Categories
Another approach to examining U of M Extension's organization outreach was to categorize the organizations thematically to better define its outreach audiences. This categorization made it possible to examine audience outreach networks.
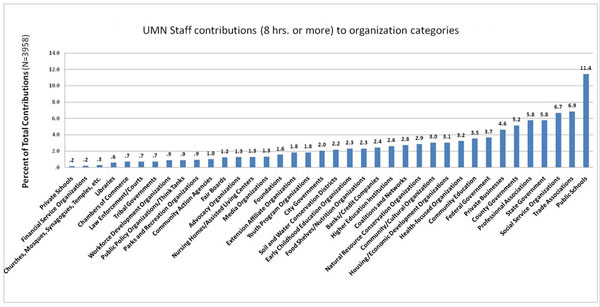
To do this we coded all organizations into thematic categories, developing and refining our categories throughout the "emergent" process. When finished, we identified 38 distinct categories in which all organizations naturally fit (Figure 5). Public Schools was by far the largest organization category in the U of M Extension network, followed by Trade Associations, Social Service Organizations, State Government, and Professional Associations.
Figure 5.
Direction and Degree of External Organization Contributions, by Category
The connections between the 38 audience categories and U of M Extension program areas were mapped (Figure 6). The red dots were categories and the relative size of each item reflected the number of connections it had.
Figure 6.
Organization Category Network, by Program Area (points sized by number of contributions delivered or received)
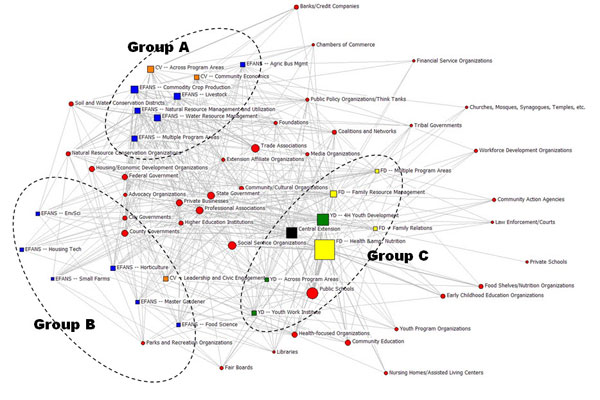
Some of what this map revealed:
- Consistent with the findings in Figure 3, there were three program area clusters in Figure 6: Group A, Group B, and Group C. Programs within these clusters had more audience categories in common.
- In the middle, between these three clusters, were the audience categories of Trade Associations, Extension Affiliate Organizations, Community/Cultural Organizations, State Government, Professional Associations, Private Business, and to some degree Higher Education Institutions. These were served by the broadest spectrum of programs and, as such, represented the core of U of M Extension's organizational outreach.
- There were many audience categories on the periphery of the network, served by a smaller spectrum of programs.
- The category of Public Schools, despite having the largest number of connections, was not core to the broad spectrum of U of M Extension programs.
The position of a category can prompt some useful questions:
- Is the position of a category where it would be expected? Do organizational assumptions need to be modified?
- Should a category strategically be positioned somewhere else on the map? For example, more central (i.e., a broader spectrum of programs should connect with it)? Who currently connects with it? Who should connect with it?
- What do the core audience connections consist of? Levels of engagement? Organization level networks within categories? Staff level networks within categories? Etc.?
- Viewing connections as a "resource capital" that currently exists, are their knowledge or contacts that can be leveraged from within to improve outreach performance?
Audience categories can be useful as well for generating information about how an organization connects with a high interest audience. A map can identify programs and staff who currently have contacts, reveal areas of high contact and areas of missing contact. For example, consider the U of M Extension's State Government category (Figure 7). On this map red circles represent state departments and related organizations. The relative size of the items on the map represents the number of connections.
Figure 7.
State Government Network, by Program Area (red circles indicate departments; points are sized by number of contributions delivered or received)
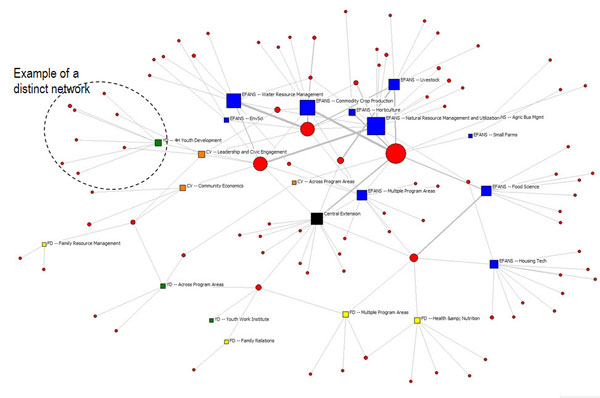
Some of what this map revealed:
- There is a broad spread of outreach to state government departments and related organizations. (Department names are removed.) Knowledge and contacts exists internally regarding a wide breadth of state government departments.
- There is a cluster of departments in the middle that are connected to a larger spectrum of programs. There are more contacts and knowledge about these departments than other departments.
- Program-specific networks with the state generally have little in common with each other (distinct networks). Is this because of distinctly separate content focuses or isolated network behavior? Would an increase in internal cross-program networks improve alignment and performance in outreach?
This has been but a small sampling of how U of M Extension has used network analysis to assess its networks.
Conclusions and Implications
The findings indicated that U of M Extension is both deeply and broadly connected to external organizations across the state. Nearly half (43%) of connections were at the "partnership" level, indicating a strong embeddedness in Minnesota communities.
The study also showed that U of M Extension's organizational network is composed of numerous smaller networks reflecting organizations that are unique to specific program areas or clusters of program areas. Whether this distinctness is primarily the result of unique program area objectives or distinct program area operations we do not know. In either case, the study has found many sub-networks that have potential to be more widely used as high-value resources for U of M Extension's outreach.
In this article we have described just a few basic ways we have used SNA to generate insights. It should be noted there are many more ways that the data collected can be analyzed. The evaluation team has identified, at the time of this writing, four primary uses for the findings:
- Accountability and reporting: Federal, state, and university-wide reporting on key organizational stakeholders and strength of these relationships. At the state government level, Extension has been able to report to the state legislature the depth of connections with state and county agencies. At the county level the results have been reported to the Association of Minnesota Counties (AMC). Furthermore, public engagement has become a university-wide focus in Minnesota. Each of the university's colleges is required to document its efforts to engage with public audiences outside the university. The study provides critical data to document Extension's public engagement efforts and has become a model for other colleges in the university to follow.
- Internal collaboration: The study has identified distinct groups of organizations associated with Extension programs. Program leaders are using the findings to engage in conversations and planning efforts with a broader range of Extension colleagues and program areas.
- Resource generation: The study identified organizational players in the private sector and in philanthropy that gain substantially from their connections to Extension. The U of M Extension development office has used this information to target financial supporters in a period of declining public resources.
- Impact evaluation: The network study lays the groundwork for a larger impact study of Extension. The organizations identified to be most connected to Extension will be surveyed to better measure Extension's impact using U of M Extension's "outcomes and impacts framework" based on the community capitals framework (Chazdon, Bartholomay, Marczak, & Lochner, 2007).
The study reported here suggests a promising future for the use of Social Network Analysis (SNA) as part of Extension's evaluation agenda. As Extension professionals deliver information through their relationships with community organizations and other social networks, it is vital that we understand the depth and breadth of these relationships and continue to monitor changes in these relationships over time. In addition to describing outreach efforts, SNA can effectively identify opportunities for internal collaboration and information sharing that support these outreach efforts.
Acknowledgements
Much of the material in this article has been included in the following presentations: Bartholomay, T. (2010, November) Why Settle for Silos? Four Applications of Social network Analysis for Building More Effective Organizational Networks and Alignment Around Outreach and New Initiatives. Demonstration session presented at the American Evaluation Association Annual Conference, San Antonio, TX; Bartholomay, T. (2011, January) Practical Application of Social network Analysis for Building More Effective Organizational Networks and Alignment Around Outreach and New Initiatives. Presentation at the Program Evaluation Discussion Series, US Department of State, Washington DC.; Batholomay, T., Chazdon, S., Marczak, M. (2008, Nov.) Utilizing Social Network Analysis in Extension: Exploring Extension's Reach. Multipaper session presented at the American Evaluation Association Annual Conference, Denver, CO.; Batholomay, T., Chazdon, S., Marczak, M., Lochner, A. (2009, March) Mapping Social Networks. Presentation at the Minnesota Evaluation Association, Minneapolis, MN.; Chazdon, S., Bartholomay, T, Walker, K. (2010, November) Mapping Extension's Networks: Using Social network Analysis to Explore Extension Outreach. Demonstration session presented at the American Evaluation Association Annual Conference, San Antonio, TX.
References
Adedokun, O., & Balschweid, M. A. (2009). Are rural 4-Hers more connected to their communities than their non-4-H counterparts? Journal of Extension [On-line], 47(1) Article 1FEA6. Available at: http://www.joe.org/joe/2009february/a6.php
Andrews, S. B., & Knoke, D. (1999). Networks in and around organizations. Stamford, CT: JAI Press.
Borgatti, S. P. (2002). NetDraw 2: Graph visualization software. Harvard: Analytic Technologies.
Borgatti, S. P., Everett, M. G., & Freeman, L. C. (2002). Ucinet 6 for windows: Software for social network analysis. Harvard: Analytic Technologies.
Cartwright, S., & Gallagher, T. (2002). Total rural capital: A model to engage Extension faculty and the public in rural community development. Journal of Extension [On-line], 40(6) Article 6TOT3. Available at: http://www.joe.org/joe/2002december/tt3.php
Chazdon, S., Bartholomay, T., Marczak, M., & Lochner, A. (2007) Using the community capitals framework for Extension impact evaluation. Paper presented at the Fourth Annual Community Capitals Framework Institute. Retrieved from:www.ncrcrd.iastate.edu/projects/commcap/2007/chazdon.pdf
Contreras, D. A. (2008). Breaking the bonds of isolation: Can home-based education increase social support levels? Journal of Extension [On-line], 46(2) Article 2RIB5. Available at: http://www.joe.org/joe/2008april/rb5.php
Dillman, D. A., & Dillman, D. A. (2000). Mail and internet surveys: The tailored design method (2nd ed.). New York: J. Wiley.
Durland, M., & Fredericks, K. A. (Eds.). (2006). Social network analysis in program evaluation: New directions for program evaluation, No. 107. San Francisco: Jossey-Bass.
Fritz, S. M., Boren, A. E., Trudeau, D., & Wheeler, D. W. (2007). Low resources in a high stakes game: Identifying viable rural community partners. Journal of Extension [On-line], 45(4) Article 4RIB2. Available at: http://www.joe.org/joe/2007august/rb2.php
Knoke, D., Yang, S., & Knoke, D. (2008). Social network analysis (2nd ed.). Los Angeles: Sage Publications.
Morse, G. W. & Ahmed, A. (2007). "Extension field specialists:" Believable label or oxymoron? Selected poster paper, American Agricultural Economics Association. Retrieved from: http://ageconsearch.umn.edu/handle/9768
Prins E., & Ewert, D. M. (2002). Cooperative Extension and faith based organizations: Building social capital. Journal of Extension [On-line], 40(3) Article 3COM2. Available at: http://www.joe.org/joe/2002june/comm2.php
PASW Statistics for Windows, Rel. 17. (2009). Chicago: SPSS Inc.
Ricketts, K. G., & Place, N. T. (2009). Making communities more viable: Four essential factors for successful community leadership. Journal of Extension [On-line], 47(2) Article 2IAW2. Available at: http://www.joe.org/joe/2009april/iw2.php
Robinson, J. W., & Meikle-Yaw, P. A. (2007). Building social capital and community capacity with signature projects: A case study of two diverse Delta communities. Journal of Extension [On-line], 45(2) Article 2FEA4. Available at: http://www.joe.org/joe/2007april/a4.php