August 2011
|
August 2011 // Volume 49 // Number 4 // Ideas at Work // v49-4iw3


Getting to Know the Economy in Your Community: Automated Social Accounting
Abstract
In response to the demand for economic base assessments in different counties and small regions, an automated social accounting matrix (ASAM) was developed through a fruitful collaboration between graduate students and Extension faculty. ASAM uses direct or customized secondary information from IMPLAN to estimate the economic contributions of different sectors and their economic multipliers. Tabular and graphic results can be rapidly customized for discussions in communities of practice. ASAM is a tool that can foster teachable moments.
Introduction
Extension faculty are increasingly requested to help characterize a local economy, assess the importance of an industry, or to determine the impact of public or private interventions. Community economic development requires tools to support public decision-making. Extension education can be more effective if there is a baseline of information to understand how the local economy works. This can create an environment where residents are encouraged to think about what their community looks like today and may look like in the near future (Shields & Deller, 2003). Information and knowledge enrich discussions among development practitioners.
One way to characterize and simulate changes in a local economy is to construct a customized social accounting matrix (SAM) for a region that represents all of the transactions that take place between the various sectors of the local economy as well as between the households, governments, institutions, and trade. The SAM can be a powerful methodology for identifying the economic linkages, clusters, and drivers in a local economy.
This article introduces a simple yet powerful tool that enables development practitioners to characterize a given local economy and implement economic base theory to assess the contributions of different economic sectors and institutions in small economies; it also enables estimation of the multiplier effect of export dollars on non-exporting sectors in the economy.
Social Accounting
Social accounting matrix (SAM) models are an expansion of input-output models, including households of different income strata as institutions that play an indirect role in the economy as consumers (and not as providers of goods or services). A SAM also incorporates critical organizational structures that determine how income (including savings, transfers, and investments) flow into the region (Leatherman & Deller, 2001). Leatherman & Marcouiller (1996) used SAM to examine the income distribution in rural economies, SAMs have been used by Waters, Weber, and Holland (1999), Seung and Waters (2006), and Watson, Taylor, and Cooke (2008) to examine economic contributions and impacts at the state level.
Social accounting economic base models share common limitations and criticisms with the standard input-output models. These limitations include the assumptions of fixed and exogenously determined levels of technology, fixed prices and factor costs, unconstrained supply of inputs, and linear production functions with exogenously determined technical coefficients (Miller & Blair, 2009).
Numerous papers have discussed the limitations of input-output models (Crompton ,1993; Frechtling 1994; Aruna, Cubbage, Lee, & Redmon, 1997; Moore & Barthlow 1998; Watson, Wilson, Thilmany, & Winter, 2007), and it is generally concluded that input-output and SAM models are appropriate for conducting economic base analysis and export-driven impact analysis for small, open economies over the medium run. Environmental and social factors (carbon emissions, energy use, housing availability and crowding, for example) can be incorporated in extended SAM models (Alarcón, van Heemst & De Jong, 2000; Xie, 2000; Lenzen & Schaeffer, 2004); however, we are not aware of non-market value extended models for small communities.
Communities Assessing Their Economies
We identify five stages working with the communities to assess their economy:
- Needs identification and delimitation of the region
- Specifications of the SAM and local knowledge-base modifications
- Computation of the SAM
- Interpretation and discussion of results
- Report writing, discussion and dissemination, and policy recommendations
County Extension educators and specialists, in collaboration with the local stakeholders, are involved in the first two stages. The extent to which the SAMs are truly representative of the local economy is dependent on both the accuracy of secondary data used (Minnesota IMPLAN Group 1999, IMPLAN.com) and how diverse and familiar the groups of stakeholders are with the economic conditions in the region. Local knowledge is often necessary to revise the congruence of figures for each industry or institution in the data set and, if necessary, to customize the SAM for non-existent industries, to adjust production functions, regional purchasing coefficients, or commuting patterns. The aggregation in the economic sectors and institutions is defined. The final product of the second stage is the industry by industry (IxI) matrix balanced and customized to the needs of the community assessment.
The third and fourth stages are carried out by Extension educators and stakeholders in the community, with support from the Extension specialist. The fourth stage includes verbalization and discussion, the identification of important linkages among sectors, and the role of institutions as indirect contributors to the regional economy, including the discussion of economic multipliers. The last stage is the write-up, which includes the regional trends in socioeconomic and environmental indicators and results from the SAM.
The Automated Social Accounting Matrix (ASAM) Model
During 2008 and 2009, University of Idaho Extension faculty worked with various communities to carry out economic base analyses (Rodríguez, Traver, Eborn, & Dye, 2010; Peterson & Rodríguez, 2010). During 2009, graduate students from the Bioregional Planning and Community Design Program (BPCDP) of the University of Idaho developed SAMs for various regions as part of a learning-practice collaborative course work in a regional economic development methods course. The automated social accounting matrix (ASAM) model presented here is the fruit of collaborative interaction between extension faculty and the BPCDP.
The automation of some procedures in steps 2-4 above offers a time-saving alternative for Extension faculty: ASAM is a macro in Excel of less than 350 kilobytes designed for the analysis of economic contributions of different sectors and institutions in the economy modeled after Waters, Weber, and Holland (1999).
The ASAM software can read the IxI matrix and employment data directly from IMPLAN (Minnesota IMPLAN Group 1999, IMPLAN.com), or data can be fed manually with primary or secondary data from other sources. Household data can be disaggregated or aggregated. It provides tabular and graphical results that compare the gross measure with respect to the base measure. The ASAM generates bar and pie charts of the top number of sectors (as specified by the user) and the rest of the sectors. The graphs can be customized by the user. Multipliers are presented in tabular form.
The ASAM at Work
The main menu shows the features of ASAM (Figure 1).
Figure 1.
ASAM Main Menu
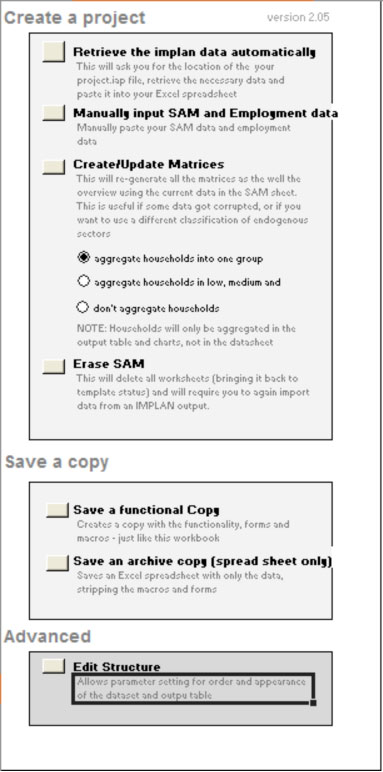
The first step is to acquire the data to build a SAM—an IxI matrix using the IMPLAN data base (*.iap or *.impdb files) or through manual input. The matrix is arranged in the following blocs:
- Disaggregated or aggregated sectors (as determined by the user)
- Value added (VA) components
- Institutions
- Exogenous sectors
The totals of the columns represent the buyers' demand of goods and services and the totals of the rows represent the sellers' supply for goods and services. Totals of rows and columns must balance out.
The second step is a series of questions asked by ASAM to confirm the size of the matrix, the last row of endogenous sectors, last row of households, and last row of industry sectors. Then, ASAM checks for the integrity of the matrix and balance of rows and columns; it asks for the level of aggregation of household information (one group, three income strata or none) and proceeds to compute the results. An IxI matrix with 50 rows and columns takes seconds to process and a 190x190 matrix may take 3 to 5 minutes depending on the computer processor.
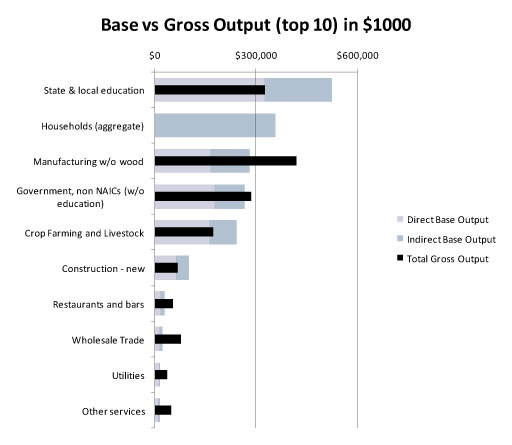
Results are displayed in tabular and graphical form to compare the gross measure (data obtained from public data) with the economic base measure (including exports and linkages among sectors and institutions). The bar chart portrays gross and base measures for each sector and/or institution (Figure 2).
Figure 2.
Top 10 Contributors to Base
Output
Pie charts for the gross and base measures are generated (Figure 3).
Figure 3.
Base and Gross
Value Added (Top 5 Contributors and the Rest)
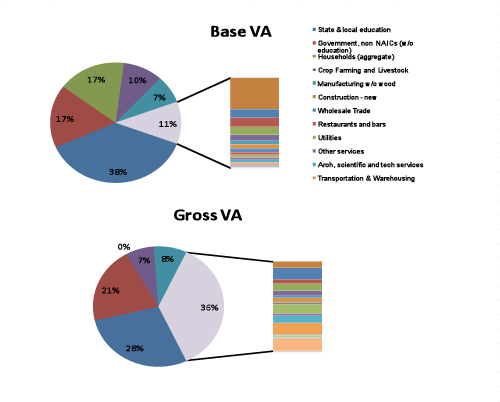
The top number of sectors and/or institutions (number specified by the user) and the rest of the sectors and/or institutions are depicted sorted with respect to their base contribution. These results are suitable for immediate discussion with development practitioners and members of the community. The ASAM is available from the authors upon request.
Concluding Remarks
Community development practitioners can benefit from ASAM for economic base analysis in various ways: economic drivers are identified taking into account inter-sectoral linkages and exports; hidden economic linkages and the role of institutions (households and transfer payments) are clear to the practitioners, which are not apparent with the traditional identification of economic drivers based on the gross measure; economic multipliers give information of economic impact in the non-exporting sectors; and communities using ASAM in a participatory manner generate knowledge that foster the teachable moments.
References
Alarcón, J., van Heemst, J., & De Jong, N. (2000). Extending the SAM with social and environmental indicators: An application to Bolivia. Economic Systems Research, 12(4):473-496.
Aruna, P. B., Cubbage, F., Lee, K. J., & Redmon, C. (1997). Regional economic contributions of the forest-based industries in the South. Forest Products Journal, 47(7/8):35-45.
Crompton, J. L. (1993). Economic impact analysis: Myths and misapplication. Trends 30(4):9-13.
Frechtling, D. C. (1994). Assessing the impacts of travel and tourism: Measuring economic benefits. In: Ritche, J.R., & Goeldner, C. (eds.) Travel, tourism and hospitality research, revised edition. New York: John Wiley and Sons.
Leatherman, J., & Deller, S. (2001). Building local government capacity: The toolbox of outreach educators. The Journal of Regional Analysis and Policy, 31(1): 91-110.
Leatherman, J., & Marcouiller, D.W. (1996). Income distribution characteristics of rural economic sectors: Implications for local development policies. Growth and Change, 27(4): 434-459.
Lenzen, M., & Schaeffer, R. (2004). Environmental and social accounting for Brazil. Environmental and Resource Economics, 27: 201-226.
Minnesota IMPLAN Group. (1999). IMPLAN-Pro Users' Manual. Stillwater, MN 55082.
Miller, R. E., & Blair, P. D. (2009). Input-output analysis: Foundations and extensions. 2nd ed. Cambridge: Cambridge University Press.
Moore, R. L., & Barthlow, K. (1998). The economic impacts and uses of long-distance trails: Featuring a case study of the Overmountain Victory Nation-al Historic Trail. National Park Service. Washington, D.C.
Peterson, S., & Rodríguez, A. (2010). The economic impacts of irrigated agriculture on the Canyon County economy and the economic base of Canyon County. Agricultural Economics Research Series No. 01-2010, February.
Rodríguez, A., Traver, S., Eborn, B., & Dye, K. (2010). Mentoring community economic development in Idaho. Journal of Extension [Online], 48(6) Article 6RIB1. Available at: http://www.joe.org/joe/2010december/rb1.php
Seung, C. K., & Waters, E. C. (2006). The role of the Alaska Seafood Industry: A Social Accounting Matrix (SAM) model approach to economic base analysis. Ann. Reg. Sci. 40:335-350.
Shields, M., & Deller, S. (2003). Using economic impact models as an educational tool in community economic development programming: lessons from Pennsylvania and Wisconsin. Journal of Extension [On-line], 41 (3) Article 3FEA4. Available at: http://www.joe.org/joe/2003june/a4.php
Waters, E. C., Weber, B. A., & Holland, D. W. (1999). The role of agriculture in Oregon's economic base: Findings from a social accounting matrix. Journal of Agricultural and Resource Economics, 24(1):266-280.
Watson, P., Taylor, G., & Cooke, S. (2008). The contributions of agriculture to Idaho's economy: 2006. University of Idaho, CIS 1144, Moscow.
Watson, P., Wilson, J., Thilmany, D., & Winter, S. (2007). Determining economic contributions and impacts: What is the difference and why do we care? Journal of Regional Analysis and Policy, 37(2), 141-146.
Xie, J. (2000). An environmentally extended Social Accounting Matrix. Environmental and Resource Economics, 16: 391-406.