August 2011
|
August 2011 // Volume 49 // Number 4 // Feature // v49-4a8


Impact of Crop Management Diagnostic Clinics on Advisors' Recommendations and Producer Practices
Abstract
Adoption resulting from University of Nebraska-Lincoln Crop Management Diagnostic Clinic (CMDC) field days was evaluated using an on-line survey. Respondents reported significant gains in skills because of CMDC, but the gains were similar across skill areas. Adoption was affected by compatibility with the cropping system, relative advantage, complexity, and trialability of practices. Diagnostic skill was stronger for more observable and frequently occurring problems. Hands-on exercises and talking to agricultural professionals were more effective learning methods compared with radio or television messages. Satisfaction with the current CMDC format was high, but bringing in more outside resource people was suggested.
Introduction
Producers and industry professionals who manage or influence 1 500 000 ha cropland attend Crop Management Diagnostic Clinic (CMDC) training by University of Nebraska-Lincoln (UNL) Extension. From 2003 to 2007, 47 CMDC field days were held in which in-field problem solving exercises were used to teach a systems approach to crop management and diagnostics. The subject matter included 141, 137, 72, and 38 sessions on crop protection, crop production, soil and water management, and nutrient management, respectively. Most attendees were agribusiness personnel who are a major source of advice for crop producers (Alston & Reding, 1998; King & Rollins, 1995). Many other advisors and producers also attended. Most were experienced and working with already fine-tuned production systems. Thus, adoption of new practices and improvement in skills can only be modest for such people (King & Rollins, 1995). However, modest changes over much production area can have significant impact.
Some practices are more readily adopted than others. Rogers (1983) reported that relative advantage, compatibility with the farming system, complexity, trialability, and observability of practices affect their adoptability. Cost of adoption is also important. Adoption typically occurs in an "S-curve" because of early adoption by a few, followed by a period of rapid adoption, and then a reduced rate of adoption (Cochrane, 1979; Rogers, 1983).
An on-line survey was conducted to address four objectives: 1) determine if respondent characteristics were related to the impact of CMDC on skill gain and change in behavior; 2) evaluate the roles of relative advantage, compatibility, complexity, cost, trialability, observability, and newness of practices in adoption or skill gain; 3) access the economic impact of CMDC; and 4) determine opportunities for improving CMDC.
Methods
In February to March 2008, requests to participate in the on-line survey were emailed to 652 attendees of one or more CMDCs held since 2003. The response rate was 23%. Respondents provided information about themselves and their operations, including profession, level of education, years of farming, area of row crops, and frequency of attending CMDC. They were asked to answer questions relating to all subject matter areas addressed at the CMDC, even if they did not attend an event addressing a specific topic. Respondents estimated the value of the CMDC training specifically for the area farmed or influenced; economic impact was calculated after halving the land area influenced by advisors, realizing that land typically is influenced by several advisors, although not all participated in CMDC. Suggestions for improvement of CMDC were requested.
The authors subjectively characterized management practices for the importance of seven factors that may affect adoption: relative economic or yield advantage; compatibility with the cropping system and available equipment, skills, and services; complexity to understand and manage for good implementation; trialability or ease of verification that the practice is effective; observability or ease of observing the benefits of the practice; newness or novelty; and implementation cost. In relating diagnostic skills to crop production problems, the problems were similarly characterized for: relative economic or yield advantage; observability or ease of observing the benefits of the practice; newness or novelty; and frequency of occurrence. Means, 95% confidence limits, and Pearson correlation coefficients were calculated using Statistix 8 (Analytical Software, Tallahassee FL). Pearson correlation coefficients were considered significant at P < 0.1.
Results and Discussion
Respondent Characteristics
The respondents included 21 producers, 95 agribusiness sales and advisory personnel, seven independent consultants, and 25 who selected "other" for profession. The non-producers, considered advisors in this study, reported that they influenced production practices on an average of 10 900 ha each (Table 1). Producers farmed an average of 458 ha of row crops. Respondents were generally well educated and experienced in crop production. Advisors were 45% more likely to have an associate or higher college degree in agriculture compared with the producers.
| Respondent Characteristics | Advisor | Producer |
| Row crop land influenced or farmed (ha) | 11 033±1 586 | 458±213 |
| CMDC attendance, yr | 2.4±0.2 | 2.7±0.6 |
| CMDC attendance, clinics yr-1 | 1.6±0.2 | 1.4±0.4 |
| Years in advising (farming) | 19.9±1.9 | 27.6±4.6 |
| Post high school education, yr | 4.5 | 3.0 |
| Degree in agriculture, associate or above | 63% | 43% |
Use of recommendations pre-CMDC was greater if farming or advising on more acres (r = 0.24, P = 0.02). Those who attended CMDC more frequently had less adoption before attending CMDC (r = - 0.22; P = 0.03), but pre-CMDC adoption was not related to other characteristics. In contrast, Alexander and Mellor (2005) found that producer age was important to adoption of corn rootworm resistant hybrids with adoption peaking at 48 years of age but that farm size was not important to adoption. Education level often is important to respondents' perception of their knowledge and use of technology prior to training (Schmitt, Durgan, & Iverson, 2000). Only years of attending CMDC was related to change caused by CMDC (r = 0.22, P = 0.03). Payback on investment, such as in the use of guidance systems and yield mapping, is expected to be greater with more land farmed resulting in increased adoption (Sunding & Zilberman, n.d.), but this was not the case in the study reported here. Responding CMDC attendees, however, may not fully represent Nebraska's producer and advisor population and may have a greater than average interest in alternative production technology.
| Advisor | Producer | |||
| Pre-CMDC† | Skill Gain‡ | Pre-CMDC† | Skill Gain‡ |
|
| Diagnostic skills | ||||
| Disease | 12 | 2.3 | 24 | 2.2 |
| Insect | 24 | 2.0 | 32 | 2.0 |
| Growth stage | 39 | 1.9 | 36 | 1.9 |
| Weed | 38 | 1.9 | 40 | 1.7 |
| Herbicide injury | 16 | 2.3 | 24 | 2.0 |
| Disease injury | 14 | 2.4 | 16 | 2.3 |
| Insect injury | 27 | 2.0 | 28 | 1.9 |
| Nutrient deficiency | 25 | 2.0 | 16 | 2.2 |
| Growth and development problems | 18 | 2.2 | 12 | 2.4 |
| Soil fertility management ability | ||||
| Timing of nitrogen application | 32 | 2.3 | 39 | 2.0 |
| Use of UNL N rates | 30 | 2.2 | 26 | 2.3 |
| Use of UNL P rates | 34 | 2.2 | 38 | 1.9 |
| Sampling for residual nitrate | 36 | 2.2 | 40 | 2.0 |
| N inhibitors | 31 | 2.2 | 47 | 2.1 |
| N credits | 33 | 2.2 | 50 | 2.0 |
| (2, 3, 4 = reinforced ability, and slight,
moderate, and great change in ability, respectively) †The confidence limit (P = 0.05) for the mean percent of advisors and producers who reported being highly skilled before CMDC was 4.9 and 6.4, respectively. ‡The mean gain in all skills attributed to CMDC, based on a subjective qualification of 1 to 5, was greater than zero but gains were similar for all topics at P = 0.05. | ||||
Impact on Knowledge and Skills
Over a third of the respondents reported being capable in identification of crop growth stages and weeds (Table 2). Many were relatively weak in identification of problems associated with growth stages and disease injury. Pre-CMDC, advisors were relatively unskilled in diagnosis of diseases, herbicide injuries, and nutrient deficiencies compared with other skills, and producers were weakest in diagnosis of nutrient deficiencies. Producers expressed 22% more confidence than advisors in soil fertility management. Most respondents reported a slight to moderate increase in all diagnostic and soil fertility management skills as a result of attending CMDC, with no significant difference by topic in gain in skill. Most respondents expressed confidence in identifying bean leaf beetle and corn rootworm adults pre-CMDC (Table 3). Respondents reported the greatest gain (38 and 50%, respectively, for advisors and producers) in identification skill for soybean aphid, spider mites, and soybean defoliating insects.
| Advisors | Producers | |||
| Insect pest | Pre-CMDC | Post-CMDC | Pre-CMDC | Post-CMDC |
| Soybean aphid | 48.0† | 55.1 | 57.1 | 66.7 |
| Bean leaf beetle | 54.3 | 55.9 | 61.9 | 66.7 |
| Soybean defoliators | 20.5 | 35.4 | 14.3 | 28.6 |
| Grasshopper | 38.6 | 39.4 | 47.6 | 47.6 |
| Western bean cutworm | 49.6 | 52.8 | 47.6 | 61.9 |
| Corn rootworm adults | 56.7 | 51.2 | 52.4 | 61.9 |
| Alfalfa weevil | 36.2 | 42.5 | 28.6 | 28.6 |
| Potato leafhopper | 38.6 | 41.7 | 14.3 | 14.3 |
| Spider mite | 40.9 | 51.2 | 28.6 | 38.1 |
| †The confidence limit (P = 0.05; CI) for the mean percent of advisors and producers who could identify insect pests pre-CMDC training was 8.5 and 16.4, respectively. The respective CI post-CMDC were 5.8 and 15.0. The CI for mean change because of CMDC was 4.5 for both advisors and producers. | ||||
Impact on Behavior and Adoption
Both producers and advisors reported >50% adoption or recommendation of genetically modified varieties pre-CMDC (Table 4). Both advisors and producers used genetically modified (GM) resistance more in corn borer compared with rootworm management pre-CMDC, probably because of earlier availability of the resistance for corn borer management.
Respondents had less adoption of guidance systems for spatially accurate equipment operation and yield mapping for spatially variable crop management compared with GM varieties (Table 4), possibly because many seed dealers attend CMDC. Producers did not attribute a significant increase in the use of guidance systems to CMDC but use of yield variability data increased by 35%. Advisors reported a gain of 21% for use of guidance systems and 23% for use of yield variability in crop management as a result of CMDC.
| Advisors | Producers | |||
| Management Practice | Pre-CMDC Mean† | Gain | Pre-CMDC Mean† | Gain |
| Percent recommended or adopted | ||||
| GMO hybrid/variety selection | ||||
| GMO selection to increase yield | † | 53.0 | 17.9±10.2 | |
| GMO selection to manage corn rootworm | 43.6 | 4.6±2.5 | 44.6 | 9.5±6.7 |
| GMO selection to manage corn borer | 53.1 | 6.4±3.2 | 51.8 | 9.5±8.4 |
| Precision agriculture | ||||
| Use of guidance systems | 41.9 | 8.8±2.7 | 38.7 | 7.1±7.3 |
| Management according to yield variation | 43.6 | 10.5±3.4 | 38.7 | 13.7±9.6 |
| Alignment with UNL nutrient management recommendation | ||||
| Soil N management | 50.8 | 4.7±2.6 | 47.0 | 8.3±8.2 |
| Soil P management | 52.7 | 3.9±3.0 | 49.4 | 9.5±6.7 |
| Soil K management | 52.3 | 2.5±2.2 | 55.4 | 4.7±5.8 |
| Soil pH management | 54.0 | 3.5±2.4 | 50.6 | 7.1±6.3 |
| Micro-nutrient management | 50.8 | 5.1±2.8 | 44.6 | 9.5±6.7 |
| Tillage and water management (percent of land area) | ||||
| No-till and conservation practices | 51.9 | 4.1±1.9 | 62.5 | 8.1±8.3 |
| Monitor crop water use and soil water | 38.8 | 12.4±3.4 | 50.7 | 14.2±9.4 |
| Weed management | ||||
| Non-herbicide strategies | 43.0 | 9.2±2.7 | 49.4 | 6.0±6.1 |
| Select the most appropriate herbicide | 57.7 | 7.9±5.0 | 60.1 | 11.9±6.8 |
| Timing of herbicide application‡‡ | 58.7 | 8.7±2.9 | 66.1 | 9.5±5.6 |
| Reduce potential for development of herbicide resistance | ||||
| Use of tillage | 30.8 | 4.3±4.5 | 30.4 | 1.2±7.6 |
| Rotate herbicides modes of action | 58.8 | 9.7±2.9 | 64.9 | 10.7±9.2 |
| Rotate crops | 55.8 | 5.5±2.8 | 79.2 | 2.4±6.3 |
| Timely herbicide application to kill weeds when small‡‡ | 63.8 | 9.6±3.2 | 72.0 | 4.8±9.9 |
| † Cells are blank because the question was not asked for agricultural advisors. The confidence limit (P = 0.05) for the mean percent of time when a crop management practice was advised or used before CMDC was 3.50 and 5.10 for advisors and producers, respectively. | ||||
Respondents were managing soil fertility according to UNL recommendations and practicing no-till or other conservation practices >50% of the time pre-CMDC (Table 4). Respondents reported mean increases in use of UNL recommendations for nutrient management of 8% for advisors and 16% for producers. The mean CMDC impact on soil K management was not greater than zero for producers and small for advisors but this topic was not much addressed in CMDC; soil K availability is generally not yield limiting in Nebraska and application typically is not profitable (Wortmann, Dobermann, Ferguson, Hergert, Shapiro, Tarkalson, & Walters, 2008). Increases in adoption of reduced tillage and other conservation practices of 8% for advisors and 13% for producers were attributed to CMDC. Advisors reported less monitoring of crop water use and soil water pre-CMDC compared with producers but adoption of monitoring crop water use and soil moisture increased by 32% for advisors and 28% for producers as a result of CMDC.
Respondents reported mean gains of 16% in adoption of weed management practices as a result of CMDC (Table 4). Advisers reported high gains in frequency of advising on the use on non-herbicide weed management strategies and producers reported a large gain in applying information on the selection of herbicides. Respondents credited CMDC for adoption of management practices for reducing the potential of developing weed resistance to herbicides, including rotation of herbicide modes of action. The impact of CMDC was relatively great for improved irrigation scheduling and nozzle performance and less for use of soil moisture sensors and surge valves (Table 5).
| Irrigation Management Practice | Advisor | Producer |
| Use of soil moisture sensors | 33.9 | 9.5 |
| Use of ET gauges | 21.3 | 19.0 |
| Irrigation scheduling | 52.0 | 47.6 |
| Improving sprinkler nozzle performance | 48.0 | 28.6 |
| Use of surge valves | 15.7 | 4.8 |
| †The confidence limit (P = 0.05) for the mean adoption by advisors and producers of irrigation management practices was 19.8 and 21.1, respectively. | ||
All practices had significant adoption pre-CMDC, but CMDC resulted in increased skills and adoption for all but a few practices. The significant adoption pre-CMDC may suggest that CMDC is not sufficiently at the cutting-edge and fails to introduce new practices for the early adopters. This would probably be a misinterpretation, however, because many topics addressed in CMDC were not specifically addressed in the survey. Also, the survey questions were generally broadly stated, encompassing numerous, and often novel, elements of a practice, such as N management. Adoption rates indicate that priority topics for future events appear to be GM technology for pest management, yield map and other spatial information, development of weed resistance to herbicides, improvement of disease diagnostic skills, N use, and irrigation.
Factors Affecting Knowledge and Adoption
Producers and advisors adopted similar production practices pre-CMDC (r = 0.75; P < 0.001; Table 4). Compatibility of a production practice to the cropping system was important to pre-CMDC adoption by producers (r = 0.57; p = 0.018) and advisors (r = 0.68; P = 0.003). The impact of CMDC on producer adoption was related to the relative agronomic or economic advantage of a practice (r = 0.53; P = 0.030). Impact of CMDC advisors' recommendations was related to practice complexity (r = 0.58; P = 0.014), trialability (r = -0.51; P = 0.035), and compatibility with the system (r = -0.55, P = 0.023). Adoption by producers resulting from CMDC was less with more pre-CMDC adoption (r = -0.45, P = 0.069), indicating that newness of the practice was important. With these exceptions, changes in practices or recommendations as a result of CMDC were not related to relative advantage, compatibility, complexity, cost, trialability, observability, newness, or cost of the practice.
Other factors may affect adoption. Changing situations may affect adoption; e.g., higher energy costs and increased concern for water and N use efficiency may have contributed to the relatively high adoption of monitoring of crop water use and soil water (Table 4). Some practices, such as surge valves to improve irrigation efficiency, become less relevant with time, while many shifted from furrow to sprinkler irrigation (Table 5). Some practices have trade-offs that affect adoption; e.g., no-till was promoted for numerous benefits, and respondents reported little use of tillage in weed management to avoid development of herbicide resistant weeds as a result of CMDC.
Observability was important to ability to diagnose crop problems (Table 2) pre-CMDC for producers (r = 0.84; P = 0.009) and advisors (r = 0.92; P = 0.001). Observability was, however, negatively correlated to gains in diagnostic ability resulting from CMDC; this was an indirect relationship because gain was negatively correlated to pre-CMDC ability, and the gains in diagnostic ability were similar for the different crop problems. Observability was likely related to knowledge level pre-CMDC and important to impact attributed to CMDC. For example, respondents were very familiar with bean leaf beetle, grasshoppers, and corn rootworm adults before CMDC, but CMDC most affected skills in identifying soybean defoliators, which many did not know pre-CMDC. Common occurrence of the problem was correlated to producers' pre-CMDC diagnostic ability (r = 0.84; P = 0.009). Relative importance and newness of the problem were not related to diagnostic ability. Producers and advisors had similar strengths and weaknesses in diagnosis as indicated by a high correlation coefficient (r = 0.77; P = 0.025).
Observability was also important to producer ability to diagnose insect pests (Table 3) pre-CMDC (r = 0.81; P = 0.009). Advisors were better able to identify insect pests of greater agronomic or economic importance (r = 0.59; P = 0.095) and less able to identify newer pests (r = -0.74; P = 0.020). The pre-CMDC skills of producers and advisors for diagnosis of insect pests were similar (r = 0.82; P = 0.007). The gain in pest identification skill due to CMDC was not related to commonness, observability, agronomic or economic importance, or newness of the pest, except that advisors gained less skill for newer pests (r = -0.65; P = 0.056).
Compatibility with the cropping system, economic or agronomic advantage, and other characteristics of management practices were related to adoption. These characteristics, however, failed to account for much of the variation in adoption of different practices. These characteristics should, therefore, be considered in prioritizing practices to promote, but the balance of other characteristics is also important.
Impact on Production and Income
The best integrator of CMDC impact was the effect on gross annual production and income. Producers reported that CMDC resulted in mean yield increases of 0.26 Mg ha-1 yr-1 corn and 0.17 Mg ha-1 yr-1 soybean (Table 6). The mean production increase per producer was 59 and 37 Mg yr-1 of corn and soybean, respectively, which gives a total mean gross income increase of $19 950 yr-1 assuming corn and soybean values of $150 and $300 Mg-1. Advisors reported mean yield increases due to CMDC of 0.30 Mg ha-1 yr-1 corn and 0.12 Mg ha-1 yr-1 soybean for land that they influence, but many appeared to over-estimate their influence, and CMDC impact was capped at 0.25 Mg ha-1 yr-1 corn and 0.12 Mg ha-1 yr-1 soybean. The value of production increases resulting from CMDC was $17 500 000 yr-1 for the 127 advisors and 21 producers who responded. Assuming this annual impact is good for a mean of 5 years, the total impact for the respondents was about $87 000 000. If impact was similar for the remaining 77% of attendees, total CMDC impact on production may be $76 000 000 yr-1, equivalent to 1.2% of the value of Nebraska's corn and soybean production.
| Yield | Total impact | ||
| Advisors | Mg ha-1 yr-1 | Mg person-1 yr-1 | $ yr-1 |
| Corn | 0.30±0.05 | 814 | 15 500 000 |
| Soybean | 0.12±0.25 | 330 | 12 500 000 |
| Advisors: impact capped to < 0.25 Mg ha-1 yr-1 corn and < 0.12 Mg ha-1 yr-1 soybean | |||
| Corn | 0.15±0.02 | 416 | 7 900 000 |
| Soybean | 0.09±0.01 | 242 | 9 200 000 |
| Producers | |||
| Corn | 0.26±0.14 | 59 | 186 000 |
| Soybean | 0.17±0.08 | 37 | 235 000 |
Learning Method Effectiveness
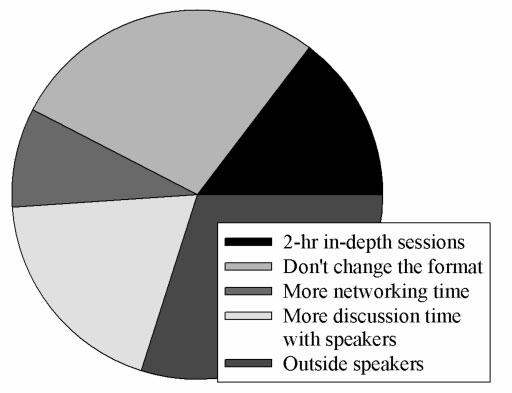
The most effective learning methods were hands-on experiences and talking to agricultural professionals (Table 7). Least effective were the press and other media. Most suggested that the CMDC format should not be changed, but some suggested having more outside speakers (Figure 1). More networking time and having 2-hour in-depth presentations were least suggested.
| Learning method | % of total |
| Hands-on in-field experience | 15.0 |
| Talking to ag professionals | 13.7 |
| Hands on classroom experience | 13.0 |
| Talking to other producers | 11.9 |
| Lecture presentations | 10.9 |
| Reading articles | 10.6 |
| Internet | 10.5 |
| Press | 7.4 |
| Radio, TV | 7.1 |
Figure 1.
Respondents' suggestions for
improvement in CMDC
Conclusions
Adoption of most management practices and skill levels were significantly increased because of attending CMDC. Producers and agricultural advisors have similar interests, but factors affecting adoption differ. Producer adoption was most affected by the agronomic or economic advantage of a practice. Advisors tended to gain most from CMDC in advising on relatively complex practices, practices that were relatively difficult to verify and practices that were not highly compatible with existing cropping systems and available skills. The impact of CMDC on production and gross income was tremendous. The hands-on experiences of CMDC are very important, and the field day format may be improved by having more outside speakers.
Acknowledgement
We are grateful to Mark Bernards, Paul Hay, Tamra Jackson, Paul Jasa, and Lowell Sandell for their contributions to the design of this survey.
References
Alexander, C. E., & van Mellor, T. (2005). Determinants of corn rootworm resistant corn adoption in Indiana. J. AgBioForum 8:197-204.
Alston, D. G., & Reding, M. E. (1998). Factors influencing adoption and educational outreach of integrated pest management, Journal of Extension [On-line], 36(3) Article 3FEA3. Available at: http://www.joe.org/joe/1998june/a3.php
Cochrane, W. W. (1979). The development of American agriculture: A historical analysis. University of Minnesota Press, Minneapolis MN.
King, R. N., & Rollins, T. J. (1995). Factors influencing the adoption of a nitrogen testing program. Journal of Extension [On-line], 33(4) Article 4RIB2. Available at: http://www.joe.org/joe/1995august/rb2.php
Peterson, J. M., Cassman, K. G., & Cantrell, R. (2002). Changes in cultural practices of farmers in southeast Nebraska as a result of their adoption of transgenic crops. Journal of Extension [On-line], 40(1) Article 1FEA5. Available at: http://www.joe.org/joe/2002february/a5.php
Rogers, E. M. (1983). Diffusion of innovations. New York: Free Press.
Schmitt, M. A., Durgan, B. R., & Iverson, S. M. (2000). Impact assessment and participant profiles of extension's education programs for agricultural chemical/seed retailers and crop advisors. Journal of Extension [On-line], 38(6) Article 6FEA2. Available at: http://www.joe.org/joe/2000december/a2.php
Sunding, D., & Zilberman, D. (n.d.) The agricultural innovation process: research and technology adoption in a changing agricultural sector. Retrieved from: http://are.berkeley.edu/courses/ARE241/fall2005/innovationchptr.pdf
Wortmann, C. S., Dobermann, A. R., Ferguson, R. B., Hergert, G. W., Shapiro, C. A., Tarkalson, D. D., & Walters, D. (2008). High yield corn response to applied phosphorus, potassium, and sulfur in Nebraska. Agron. J. 101 546-555