August 2011
|
August 2011 // Volume 49 // Number 4 // Feature // v49-4a5


Improving Measurement of the EFNEP Outcomes Using Factor Analysis of the Behavior Checklist
Abstract
This article advances the literature on assessment of EFNEP's effectiveness. Factor analysis of Behavior Checklist items were performed to arrive at a parsimonious set of constructs used to assess the effects of program attributes on participants' behavior change. Based on the data from Michigan EFNEP, the use of constructs demonstrated a robust method of assessing program effectiveness. The greatest behavior changes were with participants taught by program assistants with fewer than 2, 2-5, or more than 15 years of experience. Hispanic participants reported higher levels of behavior changes, as did participants who received EFNEP curriculum in a one-on-one setting.
Introduction
The Expanded Food and Nutrition Education Program (EFNEP) was established in 1969, through land-grant universities, in response to hunger and malnutrition of the country's poorest citizens (Randall, Brink, & Joy, 1989). EFNEP is unique among USDA programs for low-income families in that it delivers only nutrition education and referrals, but not direct food assistance like the Supplemental Nutrition Assistance program (SNAP, formerly known as food stamps). The program uses a paraprofessional model of staff from local communities delivering an educational series of lessons to participants individually or in small group settings (Luccia, Kunkel, & Cason, 2003).
Programs like EFNEP that deliver education in all 50 states and some territories, instead of food and/or health services to target populations at health risk, have struggled to demonstrate effectiveness to legislators and policy makers (U.S. General Accounting Office, 2002). Even though reports of several studies have shown EFNEP to be cost-effective (Burney & Haughton, 2002; Dollahite, Kenkel, & Thompson, 2008; Rajgopal, Cox, Lambur, & Lewis, 2002), demonstrating cost-effectiveness of the program continues to be a concern. Valid and reliable instruments to assess change resulting from nutrition education are needed to provide credible evidence of the program's efficacy (U.S. General Accounting Office, 2002), especially in recessionary times.
EFNEP is unique among federally funded food and nutrition programs in that behavioral outcomes including food intake data from program participants are required to be collected before and after program delivery and submitted for federal reports (U.S. General Accounting Office, 2002). Townsend, Kaiser, Allen, Joy, & Murphy (2003) have validated the food intake data with biomarkers from EFNEP participants. EFNEP is also nationally evaluated using a 10-item checklist of key behaviors linked to the lessons delivered. In addition to the 10 items required by the United States Department of Agriculture (USDA), Michigan has added 10 additional items to the Behavior Checklist. Based on the research reviewed, the 10-item Behavior Checklist used nationally has not been fully evaluated using factor analysis to determine if the multiple items for specific constructs actually form unified constructs (concepts or ideas). To date there has been only one factor analysis on subscale items in the checklist using a sample of about 100 participants (Townsend et al., 2003). Large samples are needed to determine constructs of the checklist via factor analysis (Hair, Black, Babin, Anderson, & Tatham, 2006) and facilitate analysis of program changes.
When quantifying constructs that are not directly measurable, multiple-item subscales are more powerful indicators of change than are single items (Gliem & Gliem, 2003). Using multi-item measures instead of single items creates more reliable constructs, because the mean score averages out measurement error (Nunnally & Bernstein, 1994). Furthermore, single-item measures tend to be less valid and less accurate than a multi-item measure, because a complex theoretical concept can rarely be fully represented by a single item (McIver & Carmines, 1981). Dollahite et al. (2008) cited the small number of items to measure a construct as a limitation to the evaluation of EFNEP. The reliability of constructs is low when based on single item measures.
The effectiveness of EFNEP can also be evaluated in terms of factors related to program delivery (Dollahite & Scott-Pierce, 2003; Hoover, Martin, & Litchfield, 2009). Three factors found in earlier studies to relate to program delivery include: 1) the length of experience of program assistants (PA), the paraprofessionals delivering the program; 2) whether the PAs deliver lessons one-on-one or in small groups; and 3) the ethnicity of program participants. To our knowledge, only in the state of Iowa has the tenure of PAs been evaluated (Hoover et al., 2009), whereas several states have examined type of lesson delivery (Cason, Scholl, & Kassab, 2002; Luccia et al, 2003; Dollahite & Scott-Pierce, 2003; Dickin, Dollahite, & Habicht, 2005). Both factors have relevance to potential cost savings in EFNEP.
The objectives of this article are, therefore, to:
- Assess how well items from the EFNEP Behavior Checklist used in Michigan comprised coherent and internally reliable constructs.
- Assess the gross impact of teaching six EFNEP lessons in food/health behaviors to participants using these constructs.
- Examine differences in behavioral outcomes from the checklist according to program attributes.
Methods
Study Design
This article is based on a secondary data analysis of pre-post data from the Behavior Checklist of 750 EFNEP participants in Michigan in 2007-08 program year.
Participants & Recruitment
All participants were EFNEP graduates of a minimum requirement of seven EFNEP lessons using the Eating Right is Basic-4 (ERIB-4) curriculum (MSUE, 2007). A total of 13 counties were represented, six rural and seven urban. EFNEP participants were the primary meal planners responsible for purchasing and preparing food for the household (USDA NIFA). In Michigan, recruitment varies by county and uses local radio, television, news, advertising, and referrals. The Supplemental Nutrition Program for Women, Infants and Children (WIC), the Michigan Department of Human Services, health departments, food banks, judicial courts, and public schools have referred participants to EFNEP. EFNEP participants who were satisfied with the program also refer their friends and families.
Data Collection
Trained Extension PAs collected data on food, nutrition, and physical activity behaviors using both dietary recalls and the Behavior Checklist administered at entry into and exit from each program series. Upon entry into the program, participants completed an Adult Family Record form recording education, race/ethnicity, pregnancy or lactation status, family/household status, and participation in other government programs. Upon program completion, participants and PAs update this form by adding the number of lessons attended and the hours of contact the participant had with the PA. Participants also add any new federal programs in which they enrolled and then they sign the form. County staff members entered Behavior Checklist and Adult Family Record data into the CRS5 software (NEERS5 Training Committee, 2008) and reviewed it for r errors and completeness. Only de-identified data were used for this study, which was approved by the Michigan State University's (MSU) Institutional Review Board.
Eating Right Is Basic Four (ERIB-4) and Behavior Checklist
The Eating Right is Basic-4th edition (ERIB-4) curriculum was developed at MSU. ERIB-4 was designed to teach individuals or small groups of people with limited resources and literacy how to choose and prepare healthful meals—that is, basic food and nutrition practices based on MyPyramid and the Dietary Guidelines for Americans (DGA). There are 14 lessons on basic nutrition, food resource management, food safety, food preparation, and eating healthfully, and completion of seven lessons is required to graduate (MSUE, 2007). Physical activity is integrated into each lesson.
EFNEP participants completed the Behavior Checklist for evaluation of the lesson impact. All participants received at least the seven basic lessons numbers 1-4 and 6-8 shown in Table 1 in a minimum of four contacts, but may have received additional lessons. Table 1 also demonstrates the relationship between the topic of each ERIB-4 lesson and items on the Behavior Checklist. The first 10 items are used to evaluate all EFNEP programs (US items) and the last 10 are particular to Michigan's program (MI items). All questions were answered using a five-point Likert scale, where 1= Never and 5=Always. Items in the checklist were based upon nutrition research to develop standard measures for routine assessment and performance reporting (U.S. General Accounting Office, 2002). Nutrition experts and field staff evaluated the checklist items for content validity. Cognitive testing and face validity were conducted with EFNEP participants for item understanding (USDA NIFA).
| Lesson Number/ Titlea | Behavior Checklist Items (abbreviated) |
| 1. Starting with the basics | I think about healthy food choices (US) I prepare foods without added salt (US) |
| 2. MyPyramid | Walk, take stairs, run with kids (MI) Participate in 30 minutes of physical activity daily (MI) |
| 3. Vegetables | I eat 3 or more kinds of vegetables daily (MI) |
| 4. Fruits | I eat more than one kind of fruit daily (MI) |
| 5. Grains | |
| 6. Food labels | I use info on food labels (US) |
| 7. Planning & making the most of food dollars | I plan meals (US) I compare prices (US) I use grocery lists (US) I budget enough money for food (MI) I track my expenses (MI) I run out of food (US) I worry if food will run out (MI) |
| 8. Food safety | I let food sit out (US) I thaw frozen meat outside the refrigerator (US) I wash my hands in soapy water (MI) I go home immediately after grocery shopping (MI) |
| 9. Meat & beans | |
| 10. Milk & calcium | |
| 11. Eating right for two | |
| 12. Breakfast & snacks | |
| 13. Feeding your new baby | |
| 14. Feeding infants & children | My children eat within 2 hours of waking up
(US) I include my children in deciding what to eat (MI) |
| aItalics indicate the seven basic lessons taught to all Michigan EFNEP participants. | |
Analysis
Descriptive statistics were analyzed for normality and outliers using the Statistical Package for Social Sciences (SPSS) version 17 (SPSS, Inc.: Chicago, IL). An exploratory factor analysis was run on the pre-test data using Varimax rotation with component extraction limited to those with eigenvalues >1 (Hair et al., 2006). For selection of constructs, only variables with factor loadings >0.60 were used. Constructs with acceptable Cronbach's alpha were α>0.60 (Nunnally & Bernstein, 1994; Santos, 1999; Robinson, Shaver, & Wrightsman, 1999). Then, values for each construct were derived by calculating the simple average of items with factor loadings >0.60 for the corresponding factor at pre and post data points. Because the pre-post data were matched by participant, paired samples t-tests were run on pre-post data using both individual items and then the constructs to assess self-reported behavior changes associated with the EFNEP program (p<0.01). One-way ANOVA were performed on the changes in the construct scores to determine if the difference in scores between the pre and post periods differed by years of experience of the EFNEP program assistants (0-2 yr, n=95; 2-5 yr, n=213; 5-10 yr, n=164; 10-15 yr, n=86; 15+yr, n=192), by type of lesson — one-on-one or small group (Hoover et al., 2009), and by ethnicity of the program participants (Hispanic versus non-Hispanic).
Results
Participants were mostly females, with a mean age of 30.9 years. Three-fourths were non-Hispanic, mirroring the ethnicity of the PAs (Table 2). One-on-one instruction was the most common type of lesson delivery (55.3%), with only two participants receiving a combination of individual and small group lessons. Most PAs (61%) had five or more years of experience in EFNEP.
| Participants (n= 750) | Program Assistants (n=18) | |
| Age (years) | 30.9 (± 10.0) | NA |
| Other adults in home | 0.9 (± 1.0) | NA |
| Gender | ||
| Female | 714 (95.2%) | 18 (100.0%) |
| Ethnicity | ||
| Hispanic | 189 (25.2%) | 5 (28.0%) |
| Non-Hispanic | 561 (74.8%) | 13 (72.0%) |
| Lesson Type | ||
| Group | 333 (44.4%) | NA |
| Individual | 415 (55.3%) | |
| Both | 2 (00.3%) | |
| Years in EFNEP | ||
| 0-2 | NA | 2 (11.1%) |
| 2-5 | 5 (27.8%) | |
| 5-10 | 3 (16.7%) | |
| 10-15 | 4 (22.2%) | |
| 15+ | 4 (22.2%) | |
| NA represents not available or not applicable | ||
Table 3 shows the results of the exploratory factor analysis. Factor selection from only the 10 behavioral items used nationally resulted in one construct, food planning/shopping (3 items, α=0.62). Selection from the 10 additional behavioral items used in Michigan resulted in two constructs: eating fruits & vegetables (2 items, α=0.647) and physical activity (2 items, α=0.742). Combining items from both checklists resulted in one additional construct, food security (2 items, α= 0.742). These four constructs accounted for 42% of the cumulative variance. Two constructs with insufficient internal reliability, food safety and children's eating habits (α=0.39, 0.55, respectively), brought the cumulative variance explained to 55%.
| Behavior Checklist (abbreviated) | Plan & Shop | Fruits & Vegetables | Physical Activity | Food Security | Food Safety | Child Eating Habits |
| I use grocery lists | 0.657 | 0.173 | -0.149 | -0.073 | -0.066 | 0.044 |
| I compare prices | 0.623 | -0.085 | 0.147 | 0.005 | -0.159 | -0.017 |
| I plan meals | 0.619 | 0.200 | -0.009 | 0.012 | -0.005 | 0.141 |
| I eat more than one kind of fruit daily | 0.002 | 0.733 | 0.138 | -0.087 | 0.104 | -0.058 |
| I eat 3 or more kinds of vegetables daily | 0.106 | 0.699 | 0.066 | 0.089 | 0.001 | 0.182 |
| Participate in 30 min of physical activity daily | -0.015 | 0.259 | 0.784 | -0.058 | -0.058 | 0.081 |
| Walk, take stairs, run with kids | 0.045 | 0.186 | 0.750 | -0.195 | -0.100 | 0.139 |
| I worry about running out of food | -0.007 | 0.043 | -0.065 | 0.852 | 0.126 | -0.005 |
| I run out of food | -0.087 | 0.000 | -0.097 | 0.836 | -0.048 | 0.049 |
| I let food sit out | 0.026 | 0.124 | -0.195 | 0.011 | 0.731 | 0.130 |
| I thaw frozen meat outside | 0.004 | -0.171 | -0.034 | 0.091 | 0.665 | -0.107 |
| I include my children in deciding what to eat | 0.110 | 0.011 | 0.181 | 0.081 | -0.101 | 0.782 |
| My children eat within 2 hr of waking | 0.316 | -0.075 | 0.153 | -0.099 | 0.052 | 0.626 |
| I track my expenses | 0.447 | 0.331 | 0.110 | -0.040 | -0.009 | 0.100 |
| I budget enough money for food | 0.434 | 0.176 | 0.281 | -0.079 | 0.301 | 0.056 |
| I think about healthy food choices | 0.277 | 0.561 | 0.211 | 0.040 | -0.153 | -0.109 |
| I use info on food labels | 0.343 | 0.505 | -0.037 | 0.021 | -0.312 | -0.063 |
| I prepare foods without salt | 0.203 | 0.039 | -0.083 | 0.009 | -0.422 | 0.178 |
| I wash my hands in warm soapy water | 0.300 | -0.120 | 0.257 | -0.052 | 0.103 | -0.510 |
| I go home immediately after grocery shopping | 0.361 | -0.263 | 0.429 | 0.289 | 0.038 | -0.112 |
| Eigenvalues | 3.338 | 1.688 | 1.450 | 1.437 | 1.331 | 1.273 |
| Percent variance accounted for by construct | 16.70% | 8.44% | 7.25% | 7.18% | 6.66% | 6.37% |
| Construct mean value | 0.763 | 0.758 | 0.302 | -0.317 | -0.868 | 0.255 |
| ± (SD) | (0.858) | (0.842) | (1.078) | (1.075) | (1.114) | (1.092) |
| Cronbach's alpha | 0.618 | 0.647 | 0.742 | 0.685 | 0.397 | 0.547 |
| Scored using 5-point Likert scale where 1=never and 5=always. | ||||||
When paired samples t-tests were run on the pre-post 20 individual items, all were significantly different (p<0.01) (Table 4). Similarly, all six constructs showed statistically significant improvement in the desired directions (p<0.001).
| Itema | Mean Change | SD | Constructa | Mean Change | SD |
| I use grocery lists | 0.969*** | 1.516 | Plan & shop | 0.763*** | 0.858 |
| I compare prices | 0.425*** | 1.216 | |||
| I plan meals | 1.077*** | 1.416 | |||
| I eat more than one kind of fruit daily | 0.428*** | 1.161 | Fruits & vegetables | 0.758*** | 0.842 |
| I eat 3 or more kinds of vegetables daily | 0.649*** | 1.252 | |||
| Participate in 30 min. of physical activity daily | 0.323*** | 1.212 | Physical activity | 0.302*** | 1.078 |
| Walk, take stairs, run with kids | 0.281*** | 1.276 | |||
| I worry about running out of food | -0.269*** | 1.441 | Food security | -0.317*** | 1.075 |
| I run out of food | -0.365*** | 1.205 | |||
| I let food sit out | -0.293*** | 1.176 | Food safety | -.0868*** | 1.14 |
| I thaw frozen meat outside the refrigerator | -1.443*** | 1.637 | |||
| I include my children in deciding what to eat | 0.356*** | 1.503 | Child eating habits | 0.255*** | 1.092 |
| My children eat within 2 hours of waking up | 0.155** | 1.380 | |||
| I track my expenses | 0.895*** | 1.431 | |||
| I budget enough money for food | 0.447*** | 1.318 | |||
| I think about healthy food choices | 0.629*** | 1.096 | |||
| I use info on food labels | 1.325*** | 1.582 | |||
| I prepare food without salt | 0.672*** | 1.479 | |||
| I wash my hands in warm soapy water | 0.085** | 0.705 | |||
| I go home immediately after grocery shopping | 0.100** | 1.012 | |||
| ***p<0.001, **p<0.01 Likert scaled, where 1=never and 5=always aItalics indicate undesirable behaviors on checklist items | |||||
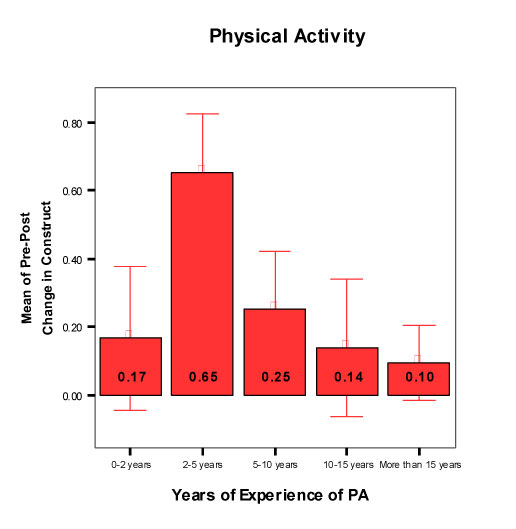
Changes in the six constructs by years of the PAs' tenure are shown in Figure 1. Changes in the six constructs by lesson type and ethnicity of participants are reported in Table 5. Food security and food safety constructs measure degree of "food insecurity" and "unsafe or unhygienic food handling practices," respectively. As such, a decline in the scores for these constructs from the pre-nutrition education class to the post-nutrition education class period reflects an improvement in reported food behavior. To facilitate comparison with other constructs, the pre-post change in these constructs presented in Figure 1 and Table 5 are converted to absolute values.
Figure 1.
Change in Participants'
Behavioral Constructs (Mean ± 95% C.I.) After EFNEP by Years of
Experience of Program Assistants
| Construct | Lesson Type | Ethnicity of Participants | ||
| Group (n=333) | One-on-One (n=415) | Hispanic (n=189) | Non-Hispanic (n=561) | |
| Plan & shop | 0.578**±0.800 | 0.910**±0.871 | 1.119***±0.874 | 0.643***±0.820 |
| Fruits & vegetables | 0.617***±0.851 | 0.869***±0.814 | 1.077***±0.940 | 0.651***±0.778 |
| Physical activity | 0.111***±1.069 | 0.454***1.064± | 0.616***±1.163 | 0.196***±1.027 |
| Food security | 0.257±1.128 | 0.366±1.032 | 0.275±1.083 | 0.332±1.073 |
| Food safety | 0.725±1.011 | 0.983±1.179 | 1.349***±1.262 | 0.706***±1.010 |
| Child eating habit | 0.249±1.098 | 0.266±1.087 | 0.307±0.942 | 0.238±1.139 |
| ***p<0.001, **p<0.01 Likert scaled, where 1=never and 5=always | ||||
Mean change in construct pre-post did not differ significantly by PAs' years of experience except for food security, where participants taught by PAs with less than 2 years experience showed significantly larger change and for physical activity where participants taught by PAs with 2-5 years experience recorded significantly larger change than the rest. Although reported change in food security differed by PAs' tenure, it did not differ by lesson type or ethnicity of participants. One-on-one instruction consistently produced bigger reported changes in all six behavioral constructs compared to group instruction, but the difference is only statistically significant for plan and shop, fruits and vegetables, and physical activity. The Hispanic participants reported statistically significant larger changes in four constructs—plan and shop, fruits and vegetables, physical activity, and food safety. Overall, EFNEP participants taught by PAs with fewer than 2 years, 2-5 years, or more than 15 years of experience demonstrated the biggest reported changes in one or more constructs. Reported changes in food safety practices were strong regardless of years of PA's tenure.
Discussion
This is the first published article to our knowledge that performed factor analysis on the Behavior Checklist from the EFNEP using a large sample. Findings confirmed six constructs, four with acceptable reliability that demonstrated significant behavioral improvements in graduates of seven EFNEP lessons. Although all 20 Behavior Checklist items showed significant pre-post changes, the constructs identified in the study reported here offer a more parsimonious set of variables to evaluate reported behavioral changes. Factor analysis, as a data reduction technique, is particularly useful to identify the most relevant items to constitute these constructs (Hair et al., 2006). Hence, reporting behavior change using the constructs results in a more powerful and reliable analysis of program change than using single items alone. The present analysis provides information useful for the new web-based reporting system for EFNEP. The constructs identified in this study represent a robust set of outcome measures that could be used to streamline the Behavior Checklist to eliminate redundant items and/or reduce respondent and PA burden.
Hoover et al. (2009) found that instructional setting did not influence differences in behavioral outcomes, although others did find such differences (Dickin et al., 2005; Cason et al., 2002). Our findings suggest that one-on-one instruction generates better-reported behavioral changes, as have others, supporting ability to generalize to other samples.
The greatest changes in three of six behavioral constructs occurred when the PAs had 2-5 years experience. This is similar to the findings of Hoover et al. (2009). Unlike Hoover et al. (2009) though, who found the second greatest changes associated with PAs having 10-15 years experience, we found it for PAs with fewer than 2 years and more than 15 years experience. The greatest changes in food security and food safety occurred with PAs having fewer than 2 years experience. This might have been due to greater enthusiasm of newer PAs on these topics. Alternatively, the lesson materials on food security and food safety might be easier for the newer PAs to learn and teach to others than the lessons on nutrition and food budgeting.
Good outcome data are always needed to demonstrate program effectiveness and identify areas for improvement. As the largest government nutrition education program that is not connected to a food distribution or feeding program (Arnold & Sobal, 2000), EFNEP suffers from lack of visibility among legislators as well as with the public. This is especially true when compared with programs like WIC, school meals and SNAP. In an uncertain economy, it becomes even more important to have robust evaluation tools to demonstrate measurable program success. Findings contained in this article are an important step toward improved program evaluation for EFNEP.
Limitations
In the present article, it was not possible to examine changes across years as two other articles have done (Hoover et al., 2009; Dollahite & Scott-Pierce, 2003) due to changes in the additional set of Behavior Checklist items across program years and uneven availability of some data in Michigan prior to 2007. For the same reasons it was not possible to examine changes by the instructors' ethnicity. Finally, the study that led to this article lacked a control group, which would have strengthened the design.
Implications
There are three important implications of the findings reported in this article.
- Factor analysis of the checklist items should be replicated with large samples from other states, and those items not performing well should be revised or dropped from the checklist.
- The possibility that some lessons might be easier or harder than others for PAs to teach should be evaluated so that training can be improved in targeted areas.
- This article provides information that, along with findings from other studies on EFNEP, can be useful for the new Web-based EFNEP reporting system, especially relating to the Behavior Checklist.
References
Arnold, C. G., & Sobal, J. (2000). Food practices and nutrition knowledge after graduation from the Expanded Food and Nutrition Education Program (EFNEP). Journal of Nutrition Education, 32(3), 130-138.
Burney, J., & Haughton, B. (2002). EFNEP: A nutrition education program that demonstrates cost-benefit. Journal of the American Dietetic Association, 102(1), 39-45.
Cason, K. L., Scholl, J. F., & Kassab, C. (2002). A comparison of program delivery methods for low income nutrition audiences. Topics in Clinical Nutrition, 17(4), 63-73.
Dickin, K. L., Dollahite, J. S., & Habicht, J. P. (2005). Nutrition behavior change among EFNEP participants is higher at sites that are well managed and whose front-line nutrition educators value the program. The Journal of Nutrition, 135(9), 2199-2205.
Dollahite, J., Kenkel, D., & Thompson, C. S. (2008). An economic evaluation of the Expanded Food and Nutrition Education Program. Journal of Nutrition Education and Behavior, 40(3), 134-143.
Dollahite, J., & Scott-Pierce, M. (2003). Outcomes of individual vs. group instruction in EFNEP. Journal of Extension [On-line], 41(2), Article 2FEA4. Available at: http://www.joe.org/joe/2003april/a4.php
Gliem, J. A., & Gliem, R. R. (2003). Calculating, interpreting, and reporting Cronbach's alpha reliability coefficient for Likert-type scales. Paper presented at the Midwest Research-to-Practice Conference in Adult, Continuing, and Community Education, Columbus, OH.
Hair, Jr., J. F., Black, W. C., Babin, B. J., Anderson, R. E., & Tatham, R. L. (2006). Multivariate data analysis (6th ed.). Upper Saddle River, NJ: Pearson Prentice Hall.
Hoover, J. R., Martin, P. A., & Litchfield, R. E. (2009). Evaluation of a new nutrition education curriculum and factors influencing its implementation. Journal of Extension [On-line], 47(1) Article 1FEA4. Available at: http://www.joe.org/joe/2009february/a4.php
Luccia, B. H. D., Kunkel, M. E., & Cason, K. L. (2003). Dietary changes by Expanded Food and Nutrition Education Program (EFNEP) graduates are independent of program delivery method. Journal of Extension [On-line], 41(3) Article 3RIB5. Available at: http://www.joe.org/joe/2003june/rb5.php
McIver, J. P., & Carmines, E. G. (1981). Unidimensional scaling. Thousand Oaks, CA: Sage.
Michigan State University Extension (2007). Eating Right is Basic-4. East Lansing, MI: Michigan State University Extension.
MyPyramid.go: Steps to a healthier you. Retrieved from: http://www.mypyramid.gov/
NEERS5 Training Committee. (2008). CRS5 Users Manual. US Department of Agriculture, Cooperative State Research, Education and Extension Service (CSREES). Retrieved from: http://efnep.fcs.msue.msu.edu/LinkClick.aspx?fileticket=ksSvPQwOMdk%3d&tabid=74
Nunnally, J. C., & Bernstein, I. H. (1994). Psychometric theory (3rd ed.). New York, NY: McGraw-Hill.
Rajgopal, R., Cox, R. H., Lambur, M., & Lewis, E. C. (2002). Cost-benefit analysis indicates the positive economic benefits of the Expanded Food and Nutrition Education Program related to chronic disease prevention. Journal of Nutrition Education and Behavior, 34(1), 26-37.
Randall, M. J., Brink, M. S., & Joy, A. B. (1989). EFNEP: An investment in America's future. Journal of Nutrition Education, 21, 276-279.
Robinson, J. P., Shaver, P. R., & Wrightsman, L. S. (1999). Criteria for scale selection and evaluation. In J.P. Robinson, P.R. Shaver, & L.S. Wrightsman (Eds.) Measures of personality and social psychological attitudes (Vol. 2), (1-35). San Diego, CA: Academic Press.
Santos, J. R. A. (1999). Cronbach's alpha: A tool for assessing the reliability of scales. Journal of Extension, [On-line], 37(2) Article 2TOT3. Available at: http://www.joe.org/joe/1999april/tt3.php
SPSS Inc. (2007). Statistical Package for Social Sciences (Version 17). Chicago, IL: SPSS Inc.
Townsend, M. S., Kaiser, L. L., Allen, L. H., Joy, A. B., & Murphy, S. P. (2003). Selecting items for a food behavior checklist for a limited-resource audience. Journal of Nutrition Education and Behavior, 35(2):69-82.
USDA, National Institute of Food and Agriculture. The Expanded Food and Nutrition Education Program (EFNEP): About EFNEP. Retrieved from: http://www.nifa.usda.gov/nea/food/efnep/about.html
U.S. Department of Health and Human Services & US Department of Agriculture. (2005). Dietary guidelines for Americans. Retrieved from: http://www.health.gov/dietaryguidelines/dga2005/document/pdf/DGA2005.pdf
US General Accounting Office. (2002). Program evaluation strategies for assessing how information dissemination contributes to agency goals. GAO-02-923. Retrieved from: http://www.gao.gov/new.items/d02923.pdf