February 2009
|
February 2009 // Volume 47 // Number 1 // Tools of the Trade // v47-1tt7


Using Computer Technology to Map Local Farms for Rapid Response in Agricultural Emergencies
Abstract
An emergency or disaster can strike at any time without warning. This article describes how educators can use computer technology to map local farms for rapid response in agricultural emergencies. Critical farm data such phone contacts, global position systems location, and resources available for disaster recovery initiatives can quickly be imported into a computer mapping program. Then, at a click of a button, the information provided from a farm is opened in a message box. This allows for quick communication to farms during an emergency. This article also describes how this technology can be used for other Extension applications.
Introduction
An emergency or disaster can strike at any time and without warning. Fires, floods, tornadoes, radiological releases, droughts, winter storms, prolonged power outages, agri-terrorism, and hazardous material releases all have the potential to affect our communities. The ability to respond quickly to any emergency is crucial, and this is no exception for the agricultural industry. Many Extension educators serve on local Emergency Management Agency boards representing the local agricultural industry in disaster situations. Extension can provide valuable assistance to county-level emergency response efforts. The vulnerability of communities can be reduced with effective preparedness (Washburn, 2006). One goal of Extension should be to share educational resources to reduce the impact of natural and manmade disasters.
The author of this article is the Agricultural & Natural Resources Extension educator in Ashtabula County, Ohio. Ashtabula County is located in the far northeast corner of the state of Ohio. Ashtabula County is in the heart of the snow-belt and is next door to Lake County, which has the Perry nuclear power plant. Due to the harsh winter weather and proximity of the nuclear power plant, Ashtabula County has a very active emergency management agency (E.M.A.). This agency responds to local emergencies and conducts mock disaster drills. OSU Extension represents the agricultural community on this board.
During actual or mock emergencies, it is often frustrating for the E.M.A. members to flip through phone books or OSU Extension mailing lists to find which farmers may be experiencing difficultly due to a given disaster. It was the goal of the educator to develop a computer mapping program that would allow for quick retrieval of contact information for local farmers during an emergency or recovery phase. This article describes how the educator was able to develop this system and how it can be used by other Extension educators.
Survey Development
Working with representatives from the National Guard, the Federal Emergency Management Agency, and the Ashtabula County Emergency Management Agency, the educator developed an agricultural disaster farm survey (Marrison, 2006). This survey was sent to the 1,280 farms in Ashtabula County. The information received from the surveys allowed the educator to map local farm data in a computer program to be used in disaster situations. Farm data collected included farm address, phone contacts, global positional system coordinates, animals and crops raised, and resources available for disaster recovery initiatives such as feed, stored water, generators, and livestock trailers. The mapping program has been installed on the laptop computers in the local Emergency Management Agency's crisis room and at the Ashtabula County Extension office.
Mapping Farm Data to an Electronic Media
The educator used the computer program Microsoft® Streets & Trips (copyright 2004 Microsoft) to develop the mapping program. There are other mapping programs that are similar in nature that could be used in the same manner. All of the data collected from the Ashtabula County disaster survey was entered into a spreadsheet, which was then imported into the computer mapping program. Clip art was then imported for use as the icons (Figure 1).
The clipart chosen indicates the main agricultural commodity of the farm. Icons developed included agronomy (ear of corn), alpaca (alpaca), beef (steer), dairy (cow), equine (horse), fruit (apple), meat processing plant (steak), and grape (vineyards/wineries). By clicking on the icon, the information provided by the local farm on the disaster survey opens in a message box. This allows for a very quick and efficient way for farms to be contacted during an emergency.
Figure 1.
Computer Screen Shot of Local Farms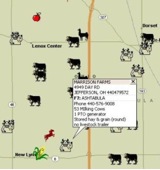
Summary
Mapping individual farm data has allowed the educator to make quick contacts to local farmers during practice disaster drills. It has also allowed the educator to work with the emergency management team to coordinate the movement of livestock trailers, feed, water, and generators during mock drills. It is hoped the mock drills will never have to be placed into practical application. A map has also been established for the farms within the 10-mile evacuation zone (Figure 2) for the Perry nuclear power plant. Another map has been developed to show farms that have available generators for use during prolonged power outages, and another was developed to map the farms with livestock trailers to move livestock in the event of an emergency.
Figure 2.
Farms in Perry Nuclear Power Plant 10-Mile Evacuation Zone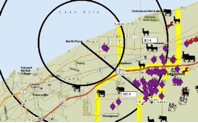
There are several additional ways this technology can be used. Educators can import individual spreadsheets to develop farm market, winery, agri-tourism, or commodity specific directories. Educators could also develop similar maps for operations who have hay for sale in the county or for farms that offer custom farm services such as hay baling, plowing, or harvesting. Educators could also use similar programs to map the location of noxious weeds (McReynolds & Howery, 2001). The author has used this technology to map the sites of Giant Hogweed, a federal noxious weed in Ashtabula County. 4-H educators could map 4-H clubs and members in the county. This map could be used to see where shortfalls are occurring with regards to membership, volunteer leadership or diversity. Educators are only limited by their imagination for developing mapping programs.
References
Marrison, D. L. (2006). Ashtabula county agricultural disaster survey. The Ohio State University. Retrieved May 12, 2008 from: http://ashtabula.osu.edu/agriculturel_natural_resources
McReynolds, K. H., & Howery, L. D. (2001). Public education, mapping, and early action to control Russian knapweed in southeastern Arizona. Journal of Extension [On-line], 39(2). Available at: http://www.joe.org/joe/2001april/a2.html
Washburn, C. (2006). Extension's role in homeland security: A case study of Washington county, Utah. Journal of Extension [On-line], 44(6) Article 6COM1. Available at: http://www.joe.org/joe/2006december/comm1.shtml