February 2009
|
February 2009 // Volume 47 // Number 1 // Feature // v47-1a1


A Regional View of Extension Employee Perceptions of Scholarship in the Workplace
Abstract
We surveyed U.S. Extension professionals on their employment experiences and personal perceptions about scholarship and compared them to the more easily defined service employment element. Further, we segmented the results by U.S. census region to identify similarities and differences among regions. Results indicate that, overall, respondents receive more satisfaction from service and believe that it is more important than scholarship in their jobs. Conversely, they believe that scholarship is more important to their institutions and that they are rewarded more for exhibiting scholarship. Finally, respondents do not believe that their host institutions have adequately defined scholarship, which creates confusion.
Scholarship in Extension
The Cooperative Extension System has long sought to delineate scholarship as it applies to Extension activities and as it seeks to gain a suitable stature within the realm of academia. With growing stakeholder demands of university accountability came a multitude of introspections by academic institutions into their institutional arrangements, including the place and role of Extension.
As a result, new discussions and debates centered on the role not only of Extension and Extension scholarship within the university, but indeed the role of the land-grant itself in the context of fulfilling its legislative mission and the scholarly activities it undertakes to achieve that mission. The result has been a reorganization of some land-grants into different institutional structures whereby Extension is considered a part of and wholly integrated into academic units. Their faculty is, therefore, evaluated using newly developed peer-review systems in which the scholarship of Extension is identified and used as a criterion for success. Though these efforts have been undertaken throughout land-grants in the United States to a greater or lesser degree, the discussion regarding whether or not, or the degree to which, this reorganization has been successful continues.
Much of the literature regarding scholarly efforts associated with Extension activities centers around the debate of defining what it is and how it occurs. Some of the relatively recent discussions of scholarship in Extension arise from the work of Boyer (1990). Boyer's opinion is that academia needs a view of scholarship that is more inclusive and delineates four equally important categories of scholarly activities: discovery, integration, application, and teaching. He states that although these are distinguishable, they are nonetheless inseparably bound. Boyer argues that a scholarly community as well as a scholarly person is able to accommodate all four of these functions.
Rice (2003), who collaborated with Boyer in the early 1990s, argues that the current thinking of what constitutes scholarship is too narrow, the result of what has been coined the "academic revolution." The "academic revolution," according to Jenks and Reisman (1968), began around 1957 and continued until approximately 1974. During this period, scholarship was considered very narrowly to be cutting edge research published in a peer-reviewed journal. This definition, argues Rice (2003), is far too narrow and outdated, given the changing demands for knowledge existing in today's information dependent society.
Bushaw (1996) applied Boyer's work to the Extension institution itself, arguing that Extension activities include all four areas of scholarship. Campbell (1991), in a review of Boyer's exposition on scholarship, also applies Boyer's model to Extension and stresses that the act of application itself in Extension can lead to new intellectual understanding.
Norland (1990) examines the Cooperative Extension System's role in the land-grant university system and argues that there is no language in any of the governing legislation that labels the Cooperative Extension System as "the service part of the land-grant mission." The notion of Extension being the "service component" of the land-grant university mission limits not only Extension's role but also can narrowly designate who in the university system engages in professional service to their communities. Norland contends that the core mission of Extension is teaching, not service, in that teaching is carried out by those in Extension as part of their mission of extending the university beyond its borders to the people where they live and work.
Extension Scholarship in Application
This new line of inquiry into what is scholarship and how Extension contributes scholarly work to the academic body as a whole, combined with new demands for different methods for learning as well as new technologies for teaching and extending knowledge beyond a university's traditional boundaries, has lead some land-grant universities to re-configure how the Cooperative Extension Service at their institution is organized and how Extension faculty are evaluated in terms of job performance and productivity. As Norman (2001) points out, these new institutional settings have required some administrators and faculty to strive to develop new models for what constitutes scholarly contributions.
For example, at Oregon State, a faculty group formed for the discussion of the implications of scholarship defined it simply: "scholarship creates something new that is validated and communicated" (Weiser, 1996). This group developed a matrix of scholarship forms and distinguished four such forms: discovery of new knowledge; development of new technologies, methods, materials, or uses; integration of knowledge leading to new understanding; and artistry that creates new insights and interpretations. Teaching, research, and extended education were defined as vital university missions and vital faculty activities but did not, in and of themselves, constitute scholarship.
In 1998, The Pennsylvania State University developed what they termed a "multidimensional model of scholarship in general, of which outreach scholarship is a key component" (Gurgevich, Hyman, & Alter, 2003). Coined as UniSCOPE (the University Scholarship and Criteria for Outreach and Performance Evaluation), Penn State's representative learning community is one of the models Penn State as a whole is using to re-define scholarship for an engaged 21st century academic institution and develop new ways for valuing and evaluating all forms of university scholarship.
What Constitutes Scholarly Activities?
Extension is not just composed of on campus, Ph.D. educated specialists. It is also composed of agents who comprise the "front line" of a university's Extension system. They can be and often are the face of the university, particularly in outlying areas. How, then, might an agent's scholarly activities be identified and evaluated? Do they even engage in scholarly activities in the course of performing their duties?
Schauber et al. (1998) report that such considerations were made in one county in Oregon for that county's Extension faculty. Oregon State uses a modified Boyer model of scholarship, with the exception that teaching is not included. This could be a problem for agents because much of their activities center around the activity of "teaching." Schauber et al. (1998) point out that, although by Oregon State University's criteria for teaching in and of itself doesn't constitute scholarly activity, certain activities within the realm of teaching can constitute scholarly activities, particularly the categories of "development" and "integration." They also discuss the original meaning of "service" within the mission of the land-grant system and how that has evolved over time.
To summarize, how scholarship is defined and what constitutes scholarship has evolved over time, particularly since the early 1990s with the publication of Scholarship Reconsidered by Boyer (1990). Academic scholars continue to search for a more inclusive, meaningful, and substantive definition, one that more accurately reflects the diverse pursuits that occur within a university environment and one that fosters cohesiveness and unity among scholars as they fulfill academic missions in the 21st century.
Purpose, Objectives, and Methods
In August 2006, a study was conducted using Zoomerang®, an online Web-based survey provider. The objective of the study was to understand Extension employee perceptions about the scholarship component of their employment.
Over 18,000 1862 land-grant university-based Cooperative Extension Service employees from the United States were sent an email and an invitation to take the survey. The list of email recipients was compiled by going to each state's Extension Web site and copying/pasting emails into a master database. For states that did not have employee emails listed on their Web sites, Extension upper administrators were contacted directly. At the end of the process, four states declined to have their employees participate. In addition, all 1890 Extension administrators were contacted via email and invited to have their employees participate. We received no responses from this population. Therefore, the study is limited to 1862 universities.
Two emails with a description of the study and the link to complete the questionnaire were sent 3 weeks apart. We received 2,749 useable responses. Accounting for undeliverable emails and emails sent to non-Extension employees, the adjusted response rate was 20%.
Non-response bias is often a common concern in survey research. Non-response is a problem in any survey because it raises the question of whether those who did respond are different in some important way from those who did not respond. In mail surveys, the bias associated with non-response is generally due to two factors (Dillman, 2000). First, individuals with an interest in the subject matter are more likely to respond than uninterested individuals. The second major bias is that well-educated individuals usually return questionnaires faster than less-educated individuals. Bias due to non-response can be evaluated by comparing those who responded to the initial mailing to those who respond as a result of subsequent mailings and other follow-up efforts (Armstrong & Overton, 1977). Research has shown that late respondents typically respond similarly to non-respondents (Donald, 1960). Accordingly, second mailing respondents, as a proxy for non-respondents, were compared to first mailing respondents for the 86 questions in the survey instrument. Differences were detected at a=0.05 for 14 questions (16%), so non-response bias was not considered to be a major problem with the responses.
The remainder of this article conveys results segmented by U.S. Census region (Figure 1). Forty-three percent of respondents were from the South. followed by 26% from the North Central region. The West accounted for 19% of respondents, and the Northeast was represented by 11%.
Figure 1.
Study Regions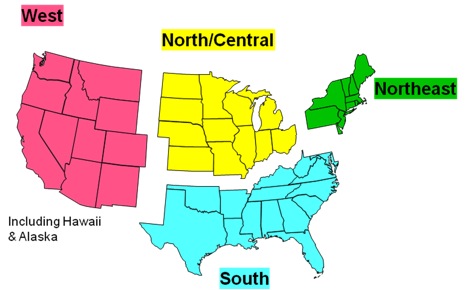
Results
Demographics
Using one-way analysis of variance (ANOVA), significant differences (at a=0.05) were found between regions for age (p=0.00), income (p=0.00), and size of respondent community (p=0.00). No difference was found for education level (p=0.71). On average, respondents from the West were oldest, and those from the South were youngest. With regard to income, respondents from the West ranked highest, and those from the North Central were lowest. Finally, Western respondents tended to live in larger communities, while Southern respondents live in the smallest average size communities. The majority of respondents across regions have an advanced degree, ranging from 78% in the Northeast to 83% in the West.
Using Pearson Chi-square tests for categorical data, significant differences were found for both race and gender frequencies, both with X2 values of 0.00. With regard to race, the West had the lowest percentage of Caucasian respondents (89%) and the highest percentage of both Hispanic and Asian respondents (5% for each category). The South had the highest percentage of African-American respondents (8%), and the West had the lowest (1%). Regarding gender, the North Central region had the highest percentage of females (54%), while the South had the lowest (43%).
Extension Scholarship and Service
In order to ensure that all respondents had the same basis to respond to questions regarding scholarship and service, the following definitions were included in the questionnaire.
Scholarship: the body of principles and practices used by scholars to make their claims about the world as valid and trustworthy as possible and to make them known to the scholarly public. In its broadest sense, scholarship can be taken to include the scientific method, which is the body of scholarly practice that governs the sciences. Scholarship can also cover rational inquiry in other areas such as history, the creations of the human mind in the form of art, music, literature, religion, philosophy, and cultural beliefs. Scholarship includes program creativity, discovery, delivery, initiative, and evaluation activities that contribute to the existing body of knowledge and improve the understanding, communication, delivery, and adoption of ideas or concepts based on technical findings (Wikipedia, 2006; Louisiana State University Agricultural Center, 2006).
Service: an act of helpful activity; the supplying of information required or demanded by the public; the duty or work of public servants; the performance of any duties or work for another; helpful or professional activity; providing aid; contribution to the welfare of others (Webster, 2006).
Respondents were asked if they were expected to exhibit scholarship as part of their Extension appointments. As seen in Figure 2, results are fairly consistent, with a range of responses answering in the affirmative from 75% (North Central) to 79% (South). Interestingly, between 4% (West) and 10% (North Central and Northeast) of respondents said they did not know if scholarship was part of their job. This implies that many Extension employees believe that they are not required to participate in scholarly activities or do not even know if they are required to do so. This suggests that better communication from supervisors would be useful in clarifying these issues.
Figure 2.
Are You Expected to Exhibit Scholarship As Part of Your Extension Job?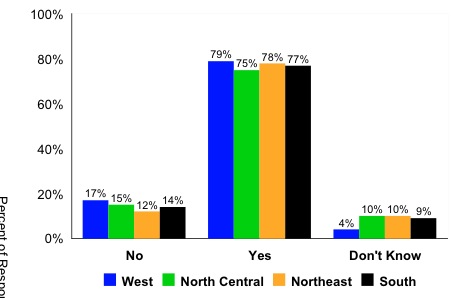
A follow-up question asked if scholarship has been defined clearly to respondents by their institution's administrators. Figure 3 indicates that for a majority of respondents in all regions this is not the case, from a low of 47% of respondents in the West to as high of 61% in the South. Ten percent of respondents in all regions said that they did not know. This finding further supports the incongruence between supervisor expectations and employee perceptions of what merits scholarship. This disparity becomes particularly important when raises are based on scholarship performance.
Figure 3.
Has Scholarship Been Defined Clearly to You by Your Institution's Administrators?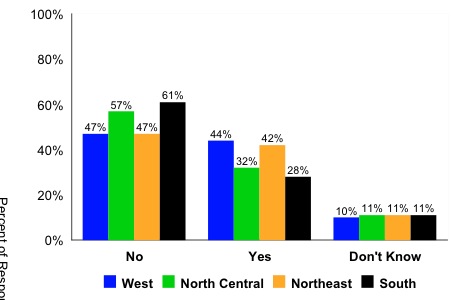
We probed this issue further by asking respondents to compare the relative importance of scholarship and service to them and their perceptions of the relative importance of each to their institutions (Table 1). Respondents in all regions feel that service is more important to them. With regard to scholarship, 65% and 66% of respondents in the West and Northeast regions, respectively, believe that scholarship in Extension is more important to their institutions than service. Conversely, 56% of respondents in both the North Central and South regions believe that their institutions value service more. Consistent with these perceptions, respondents in the West and Northeast believe that they are more rewarded for scholarship (74% and 66% of respondents, respectively), while respondents in the North Central and South regions believe that they are rewarded almost equally for scholarship and service (Figure 4).
Clearly, respondents believe that service is more important to them in their jobs. Respondents in the West and Northeast believe that scholarship is more important from the perspective of their employing institution. If, in fact, scholarship is more important in determining merit raises, promotions, and other examples of recognition, Extension employees must be provided with clear guidelines on what constitutes scholarship.
| Scholarship | Service | |||||||
| West | North Central | Northeast | South | West | North Central | Northeast | South | |
| More important to you | 24% | 21% | 24% | 15% | 76% | 79% | 76% | 85% |
| More important to your institution | 65% | 44% | 66% | 44% | 35% | 56% | 34% | 56% |
Figure
4.
For Which of the Following Do You Think You Get Rewarded More by Your Institution?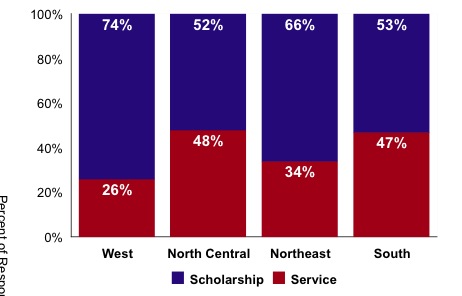
Regardless of what they believe are the priorities for their institutions, respondents from all regions were consistent in stating that service gives them a greater sense of satisfaction and accomplishment (Figure 5). This indicates that not only is service perceived to be more important in their job, it also gives respondents a significantly higher level of intrinsic satisfaction.
Figure 5.
Which of the Following Gives You a Greater Sense of Satisfaction and Accomplishment in Your Extension Job?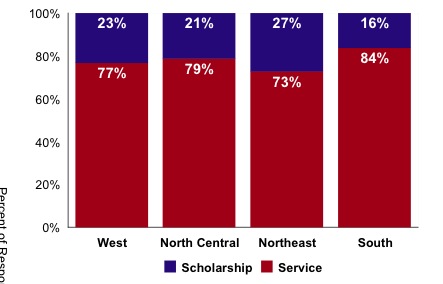
Scholarly Activities
The final bank of questions probed respondent perceptions of the validity of a variety of activities as being examples of scholarship. Principal component factor analysis with varimax rotation was conducted to identify underlying dimensions of perceived scholarly activities. Several preliminary factor analysis solutions were examined before the final factor analysis solution was found.
The 26 examples posed were reduced to 19 that can be roughly segmented into the following five factors or categories: Media Exposure, Research, Knowledge Transfer, Client Contact, and Peer Recognition. The sample size (n=2,370) for the 19 variables exceeds the minimum required number of five observations (6.3) per variable required for factor analysis (Hair, Anderson, Tatham, & Black, 1998). The Kaiser-Meyer-Olkin overall Measure of Sampling Adequacy (.838), Bartlett test of non-zero correlations (.000), Measures of Sampling Adequacy (range from .788 to .923) on the anti-image correlation matrix, and small partial correlations all indicate that the data set is suitable for factor analysis.
The latent root criterion (eigenvalue >=1) was used in extracting the factors. Orthogonal varimax rotation was used to disperse the factor loadings within the factors to achieve a more interpretable solution (Field, 2000). Accordingly, the five factors explain 64.1% of the total variance of the 19 variables as follows: Factor 1 (15.8%); Factor 2 (13.5%); Factor 3 (12.8%); Factor 4 (11.7%; Factor 5 (10.3%). The cut-off point for interpretation of the loadings was ±.50. In naming the five factors, all significant factor loadings were used in the process, but variables with higher loadings had greater influence on the factor name (Table 2).
- Factor 1 has four significantly high loadings (.730-.886), which are all related to using various forms of media to express ideas or convey information, thus the factor was named "Media Exposure."
- Factor 2 loads the highest (.808-.839) on variables associated with conducting research and conveying results through refereed journals and patents. Accordingly, the factor was named "Research."
- Factor 3 has five items with significantly high loadings (.588-.754) on variables linked with pedagogical activities and sharing information. Hence, the factor was named "Knowledge Transfer."
- Factor 4 has three significant loadings (.666-.881) that describe face-to-face interactions with clients, thus the factor was named "Client Contact."
- Factor 5 has three significant loadings (.528-.852) that describe activities where recognition is received outside of the organization, thus the factor was named "Peer Recognition."
This analysis is helpful in segmenting a multitude of items, in this case examples of scholarship, into actionable management areas.
| Factor | |||||
| Media Exposure | Research | Knowledge Transfer | Client Contact | Peer Recognition | |
| Radio interviews | .886 | .016 | .110 | .160 | .139 |
| Television interviews | .872 | .070 | .111 | .145 | .146 |
| Being mentioned in newspaper articles | .746 | .151 | .060 | .171 | .208 |
| Writing newspaper articles | .730 | .009 | .181 | .135 | .078 |
| Conducting original research | .058 | .839 | .118 | -.066 | .019 |
| Refereed journal articles | .030 | .834 | .047 | -.043 | .062 |
| Developing patents | .011 | .808 | .036 | .020 | -.049 |
| Knowledge and application of new technology | .123 | .045 | .754 | .012 | .017 |
| Innovative teaching methods | .076 | .035 | .729 | .104 | .050 |
| Program delivery effectiveness demonstrated by evaluation, change, and adoption | .011 | .062 | .615 | .172 | .140 |
| Development and presentation of research-based materials | .092 | .328 | .592 | .022 | .000 |
| Advising on critical issues | .182 | .191 | .588 | .063 | .219 |
| Number of workshops delivered | .203 | .015 | .159 | .881 | .155 |
| Number of workshops developed | .167 | .114 | .164 | .850 | .156 |
| Number of client contacts | .275 | .293 | .128 | .666 | .127 |
| Participation in and leadership of professional organizations/committees | .123 | .007 | .161 | .118 | .852 |
| Participation in public policy and community issues | .252 | .079 | .297 | .147 | .610 |
| Awards and recognition | .238 | .217 | .040 | .270 | .578 |
| Presentations at professional meetings | .115 | .235 | .167 | .043 | .528 |
| Extraction Method: Principal Component Analysis Rotation Method: Varimax with Kaiser Normalization. Rotation converged in six iterations. |
|||||
Finally, in Table 3, we present these activities, by factor, across regions. Using one-way ANOVA, the items resulting in significant differences between regions (at a=0.05) are indicated by identifying the highest and lowest average scores by region. This allows for determination of respondent perceptions for the factors and items by region. Extension administration and supervisors can identify concurrence and disparities with the scholarship goals and objectives they have established for their organizations and employees.
| Media Exposure | Region | N | Mean | p value | |
| Radio interviews | West | 506 | 1.76 | 0.000 | |
| North Central | 694 | 1.89 | |||
| Northeast | 286 | 1.69 | Lowest | ||
| South | 1179 | 1.93 | Highest | ||
| Television interviews | West | 504 | 1.74 | 0.000 | |
| North Central | 694 | 1.86 | |||
| Northeast | 288 | 1.71 | Lowest | ||
| South | 1179 | 1.95 | Highest | ||
| Being mentioned in newspaper articles | West | 507 | 1.66 | 0.000 | Lowest |
| North Central | 694 | 1.85 | |||
| Northeast | 290 | 1.68 | |||
| South | 1175 | 1.91 | Highest | ||
| Writing newspaper articles | West | 502 | 1.99 | 0.000 | |
| North Central | 693 | 2.02 | |||
| Northeast | 287 | 1.94 | Lowest | ||
| South | 1179 | 2.17 | Highest | ||
| Research | Region | N | Mean | p value | |
| Conducting original research | West | 503 | 2.47 | 0.000 | Highest |
| North Central | 694 | 2.17 | |||
| Northeast | 288 | 2.40 | |||
| South | 1174 | 2.13 | Lowest | ||
| Refereed journal articles | West | 509 | 2.39 | 0.000 | Highest |
| North Central | 690 | 2.14 | |||
| Northeast | 289 | 2.34 | |||
| South | 1182 | 2.05 | Lowest | ||
| Developing patents | West | 499 | 1.94 | 0.000 | Highest |
| North Central | 681 | 1.70 | Lowest | ||
| Northeast | 282 | 1.87 | |||
| South | 1161 | 1.72 | |||
| Knowledge Transfer | Region | N | Mean | p value | |
| Knowledge and application of new technology | West | 509 | 2.54 | 0.001 | |
| North Central | 699 | 2.52 | Lowest | ||
| Northeast | 289 | 2.53 | |||
| South | 1180 | 2.62 | Highest | ||
| Innovative teaching methods | West | 506 | 2.48 | 0.372 | |
| North Central | 699 | 2.46 | |||
| Northeast | 290 | 2.51 | |||
| South | 1184 | 2.50 | |||
| Program delivery effectiveness demonstrated by evaluation, change, and adoption | West | 511 | 2.56 | 0.035 | |
| North Central | 700 | 2.56 | |||
| Northeast | 290 | 2.66 | Highest | ||
| South | 1181 | 2.55 | Lowest | ||
| Development and presentation of research-based materials | West | 509 | 2.69 | 0.015 | Highest |
| North Central | 701 | 2.58 | Lowest | ||
| Northeast | 290 | 2.59 | |||
| South | 1184 | 2.64 | |||
| Advising on critical issues | West | 511 | 2.33 | 0.017 | |
| North Central | 699 | 2.33 | |||
| Northeast | 287 | 2.32 | Lowest | ||
| South | 1184 | 2.41 | Highest | ||
| Client Contact | Region | N | Mean | p value | |
| Number of workshops developed | West | 506 | 2.10 | 0.001 | |
| North Central | 693 | 2.04 | Lowest | ||
| Northeast | 288 | 2.06 | |||
| South | 1183 | 2.16 | Highest | ||
| Number of workshops given | West | 505 | 2.09 | 0.000 | |
| North Central | 693 | 2.04 | Lowest | ||
| Northeast | 289 | 2.07 | |||
| South | 1178 | 2.19 | Highest | ||
| Number of client contacts | West | 507 | 1.99 | 0.000 | Lowest |
| North Central | 690 | 2.08 | |||
| Northeast | 290 | 2.03 | |||
| South | 1172 | 2.21 | Highest | ||
| Peer Recognition | Region | N | Mean | p value | |
| Participation in and leadership of professional organizations/ committees | West | 510 | 2.30 | 0.071 | |
| North Central | 693 | 2.31 | |||
| Northeast | 288 | 2.35 | |||
| South | 1174 | 2.37 | |||
| Participation in public policy and community issues | West | 505 | 2.25 | 0.165 | |
| North Central | 696 | 2.32 | |||
| Northeast | 291 | 2.26 | |||
| South | 1186 | 2.31 | |||
| Awards and recognition | West | 510 | 2.12 | 0.006 | |
| North Central | 692 | 2.03 | Lowest | ||
| Northeast | 291 | 2.05 | |||
| South | 1183 | 2.13 | Highest | ||
| Presentations at professional meetings | West | 505 | 2.51 | 0.000 | |
| North Central | 697 | 2.43 | |||
| Northeast | 288 | 2.59 | Highest | ||
| South | 1179 | 2.42 | Lowest | ||
| Scale: 1=not valid at all; 2=somewhat valid; 3=extremely valid. Lowest and highest means indicated for statistical significant differences at a=0.05 level of significance. | |||||
Conclusion
The scholarship and service discussion will undoubtedly continue in the future, particularly as Extension employee goals and performance are increasingly gauged on both. The study reported here is the first of its kind to examine scholarship and service issues from the Extension employee perspective on a national scale. By dividing respondents into census regions, it is possible to compare regional responses and identify differences and similarities between regions.
Overall, 75% or more of respondents from all four regions said that they are expected to exhibit scholarship as part of their job, although an average of 50% across regions said that scholarship has not been clearly defined to them by their institutional administrators. There were also significant differences between regions in what respondents believe constitute scholarship for many of the activities presented to them.
The analysis identifies a number of potential gaps between what respondents believe and what they think their institution believes with regard to scholarly activities. This finding can help management and employees alike dialogue on this issue and, if discordance exists, come to agreement. The analysis goes further in providing a management tool that identifies specific scholarship activity areas by region. Once again, congruence between administration and employee expectations and perceptions can be evaluated. In addition, administrators and supervisors can compare the respondents in their region with other regions.
References
Armstrong, J. S. & Overton, T. S. (1977). Estimating non-response bias in mail surveys. Journal of Marketing Research, 14(3), 396-402.
Boyer, E. L. (1990). Scholarship reconsidered: Priorities of the professorate. A special report. The Carnegie Foundation for the Advancement of Teaching. Princeton, New Jersey. 147 p.
Bushaw, D. W. (1996). The Scholarship of Extension. Journal of Extension [On-line], 34(4). Available at: http://www.joe.org/joe/1996august/comm1.html
Campbell, G. R. (1991). Scholarship reconsidered. Journal of Extension [On-line], 29(4). Available at: http://www.joe.org/joe/1991winter/tt1.html
Dillman, D. A. (2000). Mail and Internet surveys: The tailored design method (2nd edition). New York: John Wiley & Sons.
Donald, M. N. (1960). Implications of non-response for the interpretation of mail questionnaire data. Public Opinion Quarterly, 24(Spring), 99-114.
Field, A. (2000). Discovering statistics using SPSS for Windows. SAGE Publications Ltd. ISBN 0761957545. 496p.
Gurgevich, E. A., Hyman, D., & Alter, T. R. (2003). Creation of UniSCOPE: A model for rewarding all forms of scholarship. Journal of Asynchronous Learning Networks, 7(2). Retrieved December 5, 2006 from: http://www.sloan-c-wiki.org/wiki/index.php?title=Creation_of_UniSCOPE:_A_Model_for_Rewarding_All_Forms_of_Scholarship%2C_JALN_7(2)
Hair, J., Anderson, R., Tatham, R., & Black, W. (1998). Multivariate data analysis 5th edition. Prentice-Hall, Inc. ISBN 0138948585 . 730p.
Jencks, C. & Riesman, D. (2001). The academic revolution. New Jersey: Transaction Publishers. 580 p.
Louisiana State University Agricultural Center. (2006). Promotion and tenure guidelines, PM-42 2006. Baton Rouge, Louisiana.
Norman, C. L. (2001). The challenge of Extension scholarship. Journal of Extension [On-line], 39(1). Available at: http://joe.org/joe/2001february/comm1.html
Rice, R. E. (2003). Rethinking what it means to be a scholar. Article adapted by R.E. Rice from work on the Carnegie Foundation's special report, The New American Scholar, by E. Boyer and R.E. Rice. Retrieved on November 29, 2006 from: http://spahp.creighton.edu/ofda/docs/Rethinking%20What%20It%20Means%20to%20be%20a%20Scholar.htm
Schauber, A., Aldrich-Markham, S., Olsen, J., Gredler, G., Olsen, P., & Reichenbach, M. (1998). Defining scholarship for county Extension agents. Journal of Extension [On-line], 36(4). Available at: http://www.joe.org/joe/1998august/iw1.html
Webster, M. (2006). Merriam-Webster dictionary. Retrieved on October 26, 2006 from http://www.m-w.com/
Weiser, C. J. (1996). The value system of a university - rethinking scholarship. American Distance Education (ADEC) Web site. Retrieved on November 2, 2006 from: http://www.adec.edu/clemson/papers/weiser.html
Wikipedia. (2006). Retrieved October 26, 2006 from: http://en.wikipedia.org/wiki/Scholarship_(scholarly_method)