August 2009
|
August 2009 // Volume 47 // Number 4 // Research In Brief // v47-4rb3


Who Attends the Extension Family Nutrition Program in a Rural State, and What Are the Preferences of Its Diverse Clientele?
Abstract
The study reported here identified
participation rates in FNP, preferred delivery methods, and most
convenient days and times for trainings. Data were collected using a
survey distributed to Food Stamp participants at Social Services
offices. The participation rate in FNP was 13.9%. FNP participants
are predominately female, never married, unemployed, and moderately
educated. The top preferred delivery methods included recipes or
cookbooks and videos. Respondents indicated afternoons, once a month
is the best time for training. These results can help FNP educators
improve services provided to participants, resulting in increased
knowledge and changed behaviors of participants.
Introduction
The Family Nutrition Program (FNP), a USDA funded nutrition education program, aims to meet the nutrition education needs of families with limited resources, including limited incomes, with the long-term goal of improved health and disease prevention (North Dakota Family Nutrition Program, 2005).
FNP is a free and voluntary educational program that teaches basic nutrition, food safety, food preparation, food resource management, and food purchasing to individuals who receive and who are eligible to receive food stamps. "The objective of FNP education is to help Food Stamp Program participants/eligibles acquire knowledge, skills, attitudes, and changed behavior necessary for maximizing resources to achieve nutritionally sound diets" (North Dakota Family Nutrition Program, 2005, p. 2).
Literature Review
According to the USDA Cooperative Extension Service (2004), North Dakota FNP education had a positive influence on food-related behaviors of families with limited incomes. After completing nutrition education sessions in 2004, participant surveys indicated that 55% decreased their consumption of fats, 97% made food purchasing changes, 94% improved food safety practices, and 96% indicated assured access to enough food without resorting to emergency food assistance.
Studies by Anding, Fletcher, Van Laanen, and Supak (2001); Campbell, Honess-Morreale, Farrell, Carbone, and Brasure (1999); and Hermann, Williams, and Hunt (2001) provide further evidence that nutrition education can improve dietary intake and behavior of low-income individuals. These studies demonstrate that nutrition education programs have been effective in making a difference in the food and nutrition behaviors of people who have limited incomes.
Despite these successes, the unduplicated number of low-income participants accessing FNP education in North Dakota is unknown, but it is estimated to be low. John, Kerby, and Landers (2004) state, "free nutrition education is available to most low-income individuals including Food Stamp Program participants but few avail themselves of the opportunity" (p. 24). "Low rates of participation in nutrition education reflect a mismatch between client preferences, the format, and content of current nutrition education, and the barriers potential clients experience that make participation difficult or impossible" (p. 34).
According to Guthrie, Stommes, and Voichick (2006), there is no "consensus on the most effective methods for delivering community nutrition education programs to achieve behavior change" (p. 7). These researchers explain that there is debate over where and how nutrition education should be delivered. Should nutrition education be delivered in print materials, individual or small group education, mass media, or by using computer-tailoring approaches? Guthrie et al. (2006) state that "also debated is the question of the 'dose' or 'intensity' of nutrition education necessary to make a difference as well as effective strategies to achieve an effective dosage" (p. 7). Identification of where, how, and how often nutrition education is offered are important issues for both those who provide the education and those who participate in the education.
Purpose of Study
The purpose of the study reported here was to identify:
- The rates of participation in FNP for Food Stamp participants,
- Delivery methods these participants prefer, and
- Most convenient days and times for trainings.
Materials and Methods
Participants
The population selected to participate in the study was Food Stamp recipients in Benson, Ramsey, and Towner counties in North Dakota. These counties were selected to participate in the study based on their racial diversity and rural environment. Study participants consisted of 100 respondents from Benson County, 137 respondents from Ramsey County, and 18 respondents from Towner County, for a total of 256 respondents. No one refused to complete the survey in Towner and Benson Counties; three individuals refused to complete the survey in Ramsey County.
Subjects were included in the study only if they met the following criteria:
- 18 years of age or older,
- English speaking,
- Identified themselves as literate,
- Currently receiving Food Stamps, and
- Applying for or renewing Food Stamp benefits in Benson, Ramsey, or Towner counties.
Instrument
The study survey was adapted from a survey developed by John et al. (2004). Extension professionals clarified wording, estimated completion time, and tested the question format. The instrument was also tested for validity by a group of low-income individuals. The survey included questions related to demographics, experiences with nutrition education programs, convenience associated with attending nutrition education, and barriers to attending nutrition education.
Procedure
Qualified subjects completed the 18-item written survey in the social services office without assistance. For completing the survey, respondents received a gift bag, which contained nutrition education materials, school supplies, coloring sheets, a food storage container, personal care items, cleaning supplies, and recipes.
The North Dakota State University Institutional Review Board (IRB) as well as the North Dakota Department of Human Services IRB approved the study procedures before research began. Statistical analysis software SAS 9.1 was used to analyze the data. Statistical analysis included frequency, mean, and chi square. A significance level of p ≤.05 was used.
Results
Characteristics of the participants are found in Table 1.
| n | % | |
| Gender | ||
| Female | 220 | 87% |
| Male | 33 | 13% |
| Age* | ||
| Under 20 years | 25 | 10% |
| 20-29 years | 92 | 36% |
| 30-39 years | 62 | 24% |
| 40-49 years | 40 | 16% |
| 50-59 years | 26 | 10% |
| 60+ years | 10 | 4% |
| Race/Ethnicity* | ||
| White/Caucasian | 127 | 51% |
| American Indian | 123 | 49% |
| African American/Black | 1 | .4% |
| Hispanic or Latino | 4 | 2% |
| Marital Status | ||
| Never Married | 119 | 47%. |
| Married | 52 | 21% |
| Divorced | 48 | 19% |
| Separated | 24 | 10% |
| Widowed | 10 | 4% |
| Employment Status* | ||
| Unemployed | 113 | 46% |
| Full time Employment | 65 | 26% |
| Part time Employment | 48 | 19% |
| Full time Homemaker | 15 | 6% |
| Retired | 7 | 3% |
| Monthly Income* | ||
| $0-$250 | 53 | 23% |
| $251 -$500 | 47 | 20% |
| $501 -$750 | 49 | 21% |
| $751-$1000 | 29 | 12% |
| $1001-$1250 | 21 | 9% |
| $1251-$1500 | 9 | 4% |
| $1501-$1750 | 13 | 6% |
| $1751 + | 13 | 6% |
| Education Level | ||
| Did not complete High School or GED | 57 | 23% |
| High school or GED | 103 | 41% |
| Some College | 56 | 22% |
| Graduated 2 year college | 29 | 12% |
| Graduated 4 year college | 5 | 2% |
| Children in Household | ||
| 1-3 children | 162 | 65% |
| 4-9 children | 37 | 15% |
| 0 children | 50 | 20% |
| Adults in Household | ||
| 1-2 adults | 212 | 85% |
| 3-8 adults | 38 | 15% |
| *Indicates greater than 3% of the completed surveys had incomplete data. Specifically, the incomplete data included age, 4% incomplete; Employment, 3% incomplete; Income, 8% incomplete; and Race, 5% incomplete. All data has been rounded to the nearest whole number. | ||
Participation in Nutrition Education Programs
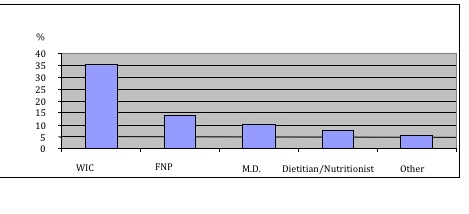
Fifty-six percent (n=142) of the respondents had participated in nutrition education in the past year. Of those respondents, 36% (n=91) received education through WIC, 14% (n=35) received nutrition education through FNP, 10% (n=26) received nutrition education from a physician, 8% (n=19) received nutrition education from a dietitian or nutritionist, and 6% (n=14) received education from another source, as seen in Figure 1.
Figure 1.
Percentage of Participation in Nutrition Education Programs
Delivery Methods
Respondents were asked to select different ways they preferred receiving nutrition education (Figure 2). Because participants could select as many delivery methods as applied to them, totals did not equal 100%. Of the respondents, 76% (n=194) preferred receiving nutrition education through reading recipes, and 56% (n=144) preferred receiving nutrition education by watching videos.
Figure 2.
Preferred Delivery Methods for Nutrition Education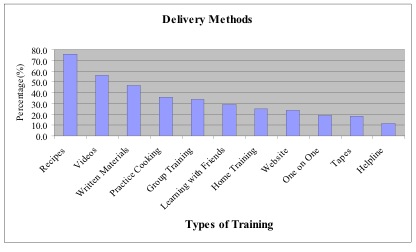
Time and Day Preference
When respondents were asked which days and times would be most convenient for in-person training, the respondents indicated the time of day they prefer as:
- Afternoon 74% (n=172),
- Evening 69% (n=160), and
- Morning 54% (n=125).
They indicated the days they prefer as:
- Weekday 64% (n=149), and
- Weekend 56% (n=130).
Totals did not equal 100%, because participants could select as many as applied to them. This question was left incomplete by 9% of respondents.
Respondents were asked how often in-person trainings would be helpful: 37% (n=86) indicated that once a month and 29% (n=67) indicated that once a week would be preferred. This data is shown in Figure 3. This question was left incomplete by 9% of respondents. Because participants could select as many as they desired, totals did not equal 100%.
Figure 3.
Preferences for Training Frequency
Discussion and Conclusions
Nearly half of respondents identified themselves as American Indian, 49% (n=123), and half as White/Caucasian, 50.6% (n=127). In addition, 30.9% (n=79) respondents indicated that they were interested in learning more about nutrition and/or cooking. Nevertheless, 56.3% (n=144) respondents did not complete this question.
There were few differences in demographic characteristics between FNP participants and those who are qualified for FNP participation but choose not to participate. Fourteen percent (n=35) of those surveyed participated in FNP. Those who participate in FNP are predominately female 80% (n=28), never married 43% (n=15), and unemployed 47% (n=16). These demographics of participants in the study are similar to the demographics of those who participated in nutrition education studies by other researchers. John et al. (2004) and Richardson, Williams, and Mustian (2003) found that the majority of participants in nutrition education targeted to low-income individuals were unmarried and unemployed.
The only demographic characteristics that were different between those who participated in any of the nutrition education programs listed and non-participants were age (p= <0.0001) and income (p=0.0208). Participants were younger and had higher incomes than nonparticipants. Kim, Hagedorn, Williamson, and Chapman (2004) also found that those who participated in educational activities were adults ages 50 and younger. Kim et al. (2004) and Johnstone and Rivera (1965) also found that higher household income was positively related to participation in education.
Because this population is also the target audience for the WIC program, it is not surprising that more than one-third, 36% (n=91), of the survey respondents attended WIC where nutrition education is required to receive benefits. John et al. (2004) also found that the most common education program attended was the WIC program (21%).
In order to increase attendance, educators for FNP should pay increased attention to the preferences these participants reported. Study respondents indicated that afternoon 74% (n=172) and once a month 37% (n=67) were the best times to offer in-person trainings. Educators could offer a series of lessons in the afternoons once a month instead of the common practice of offering sessions once a week. Education can also be offered on alternating days of the week and at alternative times to increase attendance. In addition, education could be offered in conjunction with other programs these individuals are required to attend, saving the participant's time, childcare, and transportation.
The most preferred delivery methods included recipes or cookbooks 77% (n=194), videos 57% (n=144), and written materials 47% (n=120). Educators should consider incorporating recipes, videos, and written materials into each lesson and could include a cookbook at the end of the lesson series as a participant gift. Educators could also incorporate home study courses including videos, recipes, and written materials as an alternative to attending in-person training.
Darkenwald and Merriam (1982) found the effectiveness and survival of education programs depends on a thorough understanding of the needs, problems, attitudes, and preferences of its clientele and potential clientele. In addition to employing quality educators, effective assessment of participants' needs and preferences is critical to program success. The research reported here should help FNP educators improve services provided to participants. This can result in improved knowledge, skills, and attitudes, leading to changed behaviors of FNP participants and better health of the low-income population.
References
Anding, J., Fletcher, R. D., Van Laanen, P., & Supak, C. (2001). The Food Stamp Nutrition Education Program's (FSNEP) impact on selected food and nutrition behaviors among Texans. Journal of Extension [On-line], 39(6) Article 6RIB4. Available at: http://www.joe.org/joe/2001december/rb4.php
Campbell, M. K., Honess-Morreale, L., Farrell, D., Carbone, E., & Brasure, M. (1999). A tailored multimedia nutrition education pilot program for low-income women receiving food assistance. Health Education Research, 14, 257-267.
Darkenwald, G. G., & Merriam, S. B. (1982). Adult education: Foundations of practice. New York: Harper & Row.
Guthrie, J. F., Stommes, E., & Voichick, J. (2006). Evaluating food stamp nutrition education: Issues and opportunities. Journal of Nutrition Education and Behavior, 38, 6-11.
Hermann, J., Williams, G., & Hunt, D. (2001). Effect of nutrition education by paraprofessionals on dietary intake, maternal weight gain, and infant birth weight in pregnant Native American and Caucasian adolescents. Journal of Extension [On-line], 39(1) Article 1RIB2. Available at: http://www.joe.org/joe/2001february/rb2.php
John, R., Kerby, D. S., & Landers, P. S. (2004). A market segmentation approach to nutrition education among low-income individuals. Social Marketing Quarterly, 3-4, 24-38.
Johnstone, J. W. C., & Rivera, R. J. (1965). Volunteers for learning: A study of the educational pursuits of American adults. Chicago: Aldine Publishing Company.
Kim, K., Hagedorn, M., Williamson, J., & Chapman, C. (2004). Participation in adult education and lifelong learning: 2000-01 (NCES 2004-050). U.S. Department of Education, National Center for Education Statistics. Washington, DC: U.S. Government Printing Office.
North Dakota Family Nutrition Program. (2005). County guide to program management and supervision (12th ed.) Fargo: North Dakota State University Extension Service.
Richardson, J. G., Williams, J. Y., & Mustian, R. D. (2003). Barriers to participation in Extension Expanded Food and Nutrition Programs. Journal of Extension [On-line], 41(4) Article 4FEA6. Available at: http://www.joe.org/joe/2003august/a6.php
United States Department of Agriculture Cooperative Extension Services, Public Health Departments, State and Local Food Stamp Programs. State Universities: Colorado, Iowa, Kansas, Missouri, Montana, Nebraska, North Dakota, South Dakota, Utah and Wyoming. (2004). Food Stamp Nutrition Education Program Mountain Plains Regional Report. United States Department of Agriculture. Retrieved November 14, 2005, from: http://www.humec.ksu.edu/fnp/MPR04.pdf