October 2008 // Volume 46 // Number 5 // Research in Brief // 5RIB3
Economics of Variety Selection for Cotton Cultivars in the Lower Rio Grande Valley, Texas
Abstract
The study reported here compared the net income of cotton cultivars grown in the Lower Rio Grande Valley using simulation techniques to incorporate yield and price risk. The data comes from field plots north of Weslaco, Texas from 2003 to 2005. Four cotton cultivars were used, two Delta and Pine (DP 444 BG/RR, and DP 555 BG/RR) and two Fibermax (FM 832, and FM 989 RR). DP 555 BG/RR had the highest average net income, $386 per acre, followed by DP 444 BG/RR, FM 832, and FM 989 RR, with $334.95, $284.31, and $278.21 per acre, respectively.
Introduction
Price and production risk are very important issues to take into consideration in agriculture. Price risk is the result of changes in supply and demand in the world market, and producers usually have to take the price given by the markets. Production risk, on the other hand, is the result of changes in production due mainly to weather, pest control, crop mix, variety mix, and inputs. Besides weather and insect pests, most of the time producers have complete control of the other variables such as crop mix, variety mix, and inputs. Good management over these production variables is key to remain competitive.
Cotton variety trials are conducted yearly to monitor the characteristics of newly developed cotton varieties. These tests include cultivars submitted by seed companies and are typically conducted by state agricultural experiment stations. These trials provide producers useful information on the performance of different cultivars recording yield, turn out, quality, production practices, etc. The information provided by the variety trials helps manage some of the production risk by improving choice of the variety that performs best for the region in terms of yield and lint quality. However, it is important to consider results from several years because results may vary between years.
Objective
The objective of the study reported here was to compare the net income of four different cotton cultivars grown in the Lower Rio Grande Valley using simulation techniques to incorporate yield and price risk.
Methodology
The data for this study comes from field plots on the Hiler Research Farm, north of Weslaco, TX from 2003 to 2005 (Table 1). Around 60 varieties were planted each year. Each variety was replicated four times in a randomized complete block design. The tests were planted using a two-row cone planter. Plots were 30 feet by four rows (40-inch row center), with 5-foot alleys at the end of each plot.
Four different cotton cultivars were used in this study, two Delta and Pine (DP 444 BG/RR, and DP 555 BG/RR), and two Fibermax (FM 832, and FM 989 RR). They were chosen because they were the only varieties planted for three consecutive years, 2003 to 2005, at the Hiler Research Farm. All varieties were transgenic except for FM 832. Moreover, the 2006 USDA Commodity Credit Corporation (CCC) loan rates were used to determine the lint price (Table 1).
| DP 444 BG/RR | DP 555 BG/RR | FM 832 | FM 989 RR | |||||
| Yield | Price | Yield | Price | Yield | Price | Yield | Price | |
| (lbs/ac) | ($/lb) | (lbs/ac) | ($/lb) | (lbs/ac) | ($/lb) | (lbs/ac) | ($/lb) | |
| 2003 | 1,485 | 0.585 | 1,771 | 0.580 | 1,276 | 0.592 | 1,408 | 0.589 |
| 2004 | 1,517 | 0.571 | 1,447 | 0.568 | 1,429 | 0.548 | 1,306 | 0.579 |
| 2005 | 2,128 | 0.593 | 2,053 | 0.592 | 1,629 | 0.594 | 1,756 | 0.594 |
A simulation model was use to empirically estimate the net income (NI) distributions for alternative cotton varieties in 2006. The simulation model is represented by:

Where: Ỹi is stochastic yield of variety i
 is
stochastic price for variety i
is
stochastic price for variety i
V1j is the per yield unit variable harvesting cost for variety i
V2j is the per acre production cost for variety i
Fi is the fixed cost of variety i
Prices and yields are the stochastic variables in the model. A GRKS distribution of prices and yields was estimated and used to simulate these variables. The GRKS distribution was developed by Gray, Richardson, Klose, and Schuman to simulate subjective probability distributions based on minimal input data (Richardson, 2005). The GRKS distribution is a closed form distribution, which eliminates the possibility of values exceeding reasonable values observed, i.e., negative yields and prices. The parameters for this distribution are the minimum, mid point, and maximum values of the data, hence the need for at least 3 years of data. A shortcoming of the GRKS distribution is that it does not correlate prices and yields.
Cost of production budgets were constructed for each variety (Appendix 1). Input prices were taken from the 2006 Texas Crop Enterprise Budgets prepared by the Texas Cooperative Extension at Texas A&M University (Texas Coop. Ext., 2006). Cost of production were the same for all varieties, because all varieties were treated the same way in the variety trials, except for harvest, hauling, and ginning cost since these cost are related to yield and vary among the four varieties (Appendix 1). Also, seed cost and technological fees were collected and matched to each variety.
Net income for each variety was simulated for 100 iterations using Monte Carlo simulation techniques. Simulated probability distributions of net income for each of the four cotton varieties were used as an indicator of their risk and profitability. A stop light chart with target values was used to summarize and compare the results of the simulated probability distributions of net income.
Results and Discussions
Table 2 shows the average net income for each of the four cotton varieties ranked from highest to lowest. Also, it includes gross income and lint yield per acre for each of the selected varieties. The numbers next to the gross income and lint yield columns are the rankings of each variety for either gross income or lint yield. To illustrate, DP 555 BG/RR gives the highest average net income with $386 per acre and is also ranked 1st on average gross income and lint yield. DP 444 BG/RR is ranked 2nd in average net income, gross income, and lint yield per acre with $334.95, $954.30, and 1,632.19 pounds per acre, respectively. However, FM 832 is ranked 3rd in average net income per acre while being 4th in average gross income and lint yield. Finally, FM 989 RR has the lowest average net income, but is ranked 3rd in average gross income and lint yield.
These results show the importance of using net income as the better decision criteria. Gross income only includes yield and price, while net income incorporates all the cost associated with the production of the different varieties including seed cost, technology fees (for GMO varieties), and harvesting cost per lb. These costs tend to be different for each variety so they will affect the bottom line, which in this case is the net income for each cotton variety. A variety could have the highest net returns among all varieties, but if its cost of production is also the highest, it may not be the variety with the highest net income.
| Net Income | Gross Income | Yield | |||
| ($/ac) | ($/ac) | (lbs/ac) | |||
| DP 555 BG/RR | 386.00 | 1,021.98 | (1) | 1,763.53 | (1) |
| DP 444 BG/RR | 334.95 | 954.30 | (2) | 1,632.19 | (2) |
| FM 832 | 284.31 | 839.11 | (4) | 1,438.28 | (4) |
| FM 989 RR | 278.21 | 856.81 | (3) | 1,457.60 | (3) |
The results listed in Table 2 give very important information because they show producers or decision-makers how much net income they should expect on average from each variety. However, it does not account for the production risk because it only gives the average net income. Therefore, a better way of comparing profitability among varieties is using simulation to populate a probability chart or stop light chart (Figure 1).
For Figure 1, the target values or lower and upper limits were arbitrarily chosen to be $250 and $350 per acre, respectively. Usually the lower limit is chosen to be $0 given the probability of losing money, but because none of the varieties have a chance of losing money due to very high yields in the variety trial plots, the lower target value was set at $250 to illustrate the methodology. The different colors represent net income ranges given by the target values and the numbers represent the probability of being below, in between, or above the specific target value.
To illustrate, FM 832 have a 24% chance of having net income below $250 per acre, 68% chance of having net income between $250 and $350 per acre, and 8% chance of having net income higher than $350 per acre. Using the same approach, DP 555 BG/RR have a 3%, 26%, and 71% chance of having net income below $250, between $250 and $350, and above $350 per acre, respectively. Also, comparing both BG/RR technologies, DP 555 has a 13% chance of 1net income below $250 per acre, while DP 444 has only 1% chance net income below $250 per acre. However, DP 555 has a 71% chance of net income higher than $350 per acre compared to only 31% for DP 444.
Figure 1.
Stop Light Chart for Probabilities Less Than $250 per Acre and
Greater Than $350 per Acre for Four Cotton Varieties
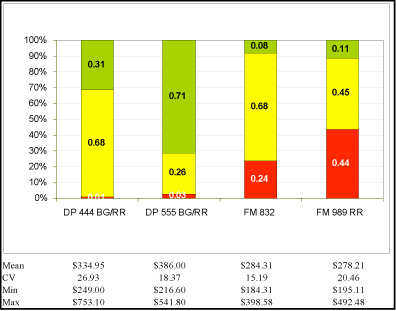
Moreover, listed at the bottom of Figure 1 are the mean or average net income (same as in Table 2.), the coefficient of variation (CV), and the minimum (Min) and maximum (Max) expected net income. The CV is a measure of variability or risk, and in the study reported here the CV measured the variability or consistency of the net income for a specific variety; the lower the CV, the more consistent the variety. In other words, the variety with the lowest CV will have a higher chance of getting net income closer to the mean. The Min and Max values give the minimum and maximum expected net income.
To illustrate, FM 989 RR has an average net income of $278.21 per acre, but also has the potential to reach $492.48 per acre in good years and $195.11 per acre in bad years. DP 444 BG/RR has an average net income of $334.95 per acre, with the potential of reaching $753.10 per acre in good years and $249 per acre in bad ones.
Producers can use this information to make better decisions on the varieties that they will plant. If the producer is interested in the variety that has the highest average net income, then DP 444 BG/RR gives the highest followed by DP 555 BG/RR, FM 832, and FM 989 RR. If the producer is more interested in the variety that has the lowest variability, i.e., lowest CV, then FM 832 has the lowest variability followed by DP 555 BG/RR, FM 989 RR, and DP 444 BG/RR. Moreover, if having the highest minimum net income is the most important criteria, then DP 444 BG/RR is best followed by DP 555 BG/RR, FM 989 RR, and FM 832. Finally, if the producer is interested on the variety that has the potential on having the highest net income, then DP 444 BG/RR is the best followed by DP 555 BG/RR, FM989 RR, and FM 832.
Summary and Conclusions
Price and production risk are very important issues to take into consideration in agriculture. The usage of cotton variety trials conducted by state agricultural experiment stations provide useful information to producers on the performance of different cultivars recording yield, turn out, quality, production practices, etc. The implementation of simulation techniques provides Extension faculty additional information on crop and variety mix to help producers in their regions.
This sort of information could be added to the crop variety trials conducted by Extension faculty and published along with the yield data. The additional information provided could help Extension faculty to better address the issue of how to manage some of the production risk by choosing the variety that performs best for the region in terms of yield and quality. Moreover, this methodology could be used on all crop and livestock production.
DP 555 BG/RR had the highest average net income, $386 per acre, followed by DP 444 BG/RR, FM 832, and FM 989 RR, with $334.95, $284.31, and $278.21 per acre, respectively. However, when production risk is taken into consideration, choosing the best variety is not as clear as above. If the producer is more interested in the variety that has the lowest variability, i.e., lowest CV, then FM 832 has the lowest variability, followed by DP 555 BG/RR, FM 989 RR, and DP 444 BG/RR. Moreover, if having the highest minimum net income is the most important criteria, then DP 444 BG/RR is best followed by DP 555 BG/RR, FM 989 RR, and FM 832. Finally, if the producer is interested in the variety that has the potential on having the highest net income, then DP 444 BG/RR is the best, followed by DP 555 BG/RR, FM989 RR, and FM 832.
Limitations of the Study
- Application of this methodology depends on the availability of at least 3 years of yield trial information, which is hard to get.
- A shortcoming of the GRKS distribution is that it does not correlate prices and yields. Therefore, if there is a significant correlation between prices and yields, the model will overstate the risk if the correlation coefficient is negative and understate the risk if the correlation coefficient is positive.
References
Richardson, J. W. (2005). Simulation for applied risk management. Department of Agricultural Economics, Texas A&M University, College Station.
Texas Cooperative Extension. (2006). Texas crop enterprise budgets for 2006. Texas A&M University, College Station.
| DP 444 BG/RR | DP 555 BG/RR | FM 832 | FM 989 RR | |
| Average Yield (lbs) | 1,632 | 1,764 | 1,438 | 1,458 |
| Variable Cost | ||||
| Seed cost | $27.43 | $28.74 | $20.90 | $20.90 |
| Technological fee | $34.53 | $34.53 | $0.00 | $21.56 |
| Custom spray, and scout | $20.50 | $20.50 | $20.50 | $20.50 |
| Fertilizer | $35.00 | $35.00 | $35.00 | $35.00 |
| Herbicide | $17.54 | $17.54 | $17.54 | $17.54 |
| Insecticide | $48.36 | $48.36 | $48.36 | $48.36 |
| Growth regulator and harvest aid | $20.09 | $20.09 | $20.09 | $20.09 |
| Insurance | $12.00 | $12.00 | $12.00 | $12.00 |
| Tillage, fuel, repair, irrigation, and labor | $124.67 | $124.67 | $124.67 | $124.67 |
| Harvesting and hauling | $195.86 | $211.62 | $172.59 | $174.91 |
| Irrigation Supplies | $9.49 | $9.49 | $9.49 | $9.49 |
| Fixed Costs | ||||
| Machinery and equipment depreciation | $73.55 | $73.55 | $73.55 | $73.55 |
| Total | $619.02 | $636.09 | $554.69 | $578.57 |