October 2008 // Volume 46 // Number 5 // Feature Articles // 5FEA3
Improving Agricultural Profitability Through an Income Opportunities for Rural Areas Program
Abstract
Significant changes in the landscape of the south central region of Pennsylvania have created new challenges and demands for Cooperative Extension and the agricultural community. Extension developed a program to help both experienced and new farmers recognize and implement new value-added and marketing opportunities. The Income Opportunities Program offered conferences, educational workshops, and one-on-one consultation by an Extension educator specifically hired for this program. Results from the formative evaluation indicated that program participants started 154 new enterprises, created 44 new part and full time jobs, increased profitability, and invested almost $1 million back into the local economy.
Introduction
The past decade has brought about significant changes in the landscape of the south central region of Pennsylvania and consequently, new challenges and demands for Cooperative Extension and the agricultural community. These changes, such as an increased number of new housing developments, high traffic volume, and the rapid changes of the urban/rural interface, can be linked to the access of several highway systems that intersect the region. Access to interstate highways has allowed for easy travel into three major metropolitan areas, Philadelphia, Baltimore, and Washington D.C., all within a 3-hour drive (Franklin County Development Corporation, 2006). This has in turn, resulted in a large number of daily commuters who moved their families and homes to the south central region.
From 2000 until 2005, the region experienced a 5% increase or a total of 41,488 new housing units (US Census Bureau, 2006). According to a recent report, about 60% of people buying into the new subdivisions are from outside the area but commuting back into cities like Baltimore, Washington D.C., and Philadelphia (Hook, 2006), while the rest work locally. Generally, these new residents tend to be educated, have a higher disposable income (US Census Bureau, 2006), and demonstrate interesting habits related to food preferences. They have an interest in nutritious, wholesome and gourmet foods, including both organic and local, and are willing to pay a premium and experiment with new recipes and food items (Orr, 2006). These preferences, along with greater income, provide an opportunity for the local agricultural community to respond to a new local market.
The implications of these changes for some of the experienced farmers in the region and their children are great. These farmers tend to have older farms that demand large capital investment. Under current market conditions, they face fluctuating commodity prices in dairy, decreasing profit margins with the agronomic crops, declining agricultural markets for their traditional crops such as corn and soybeans, and spiraling land values that often prohibit the purchase or ability to rent more farmland to increase profits (Kays, 1998). Some have children, home from college (Huff, 2005), who would like to remain on the farm and are challenged to find a niche that will generate enough additional income to support a younger, growing family (Fannin, 2004). While these experienced farmers and their children are knowledgeable about agriculture, many lack ideas and information on how to remain in farming and increase their income by responding to the consumer demands of the new market.
Coupled with the population growth of the south central region of Pennsylvania, there has been an extraordinary parallel growth in the number of small farms ranging from 1 to 49 acres (National Agricultural Statistics Service, 2005). In recent years, Extension educators have identified that several groups of new farmers have emerged on these small farms. They include, first, persons who have made money elsewhere, some of whom are retired and some who grew up on a farm and seek to establish an agricultural enterprise. This successful generation can afford to invest in smaller albeit expensive parcels of land but lack information and ideas about the types of agricultural ventures that will flourish, create income, and respond to the demands of the new markets.
Another group of new farmers to emerge is also the fastest growing group, namely women farmers who are the owners and managers of their own farms. "Beginning in 1982, the average age of women farmers began to decrease, and by 1997 more than 40% were under 55 years old," a trend that is likely to continue (Women in Agriculture, 2007). In 2002 in fact, the Census of Agriculture reported a 13.4% increase in the number of farms operated by women since 1997 (Hoffman & Norton, 2005). Economists and others suggest this is a direct result of high demand for organic produce, specialty crops, and other niche products (Radke, 2006), although these women also run dairy farms and other traditional farms.
A sociological team in Pennsylvania has found several age groups of women moving into active farming as a career. They include middle-aged and older women who have accumulated the necessary resources to buy land and have turned to farming as a second career. They also include younger women who have created organic and sustainable operations that involve direct marketing techniques (Parker, 2007). Other groups include women who are partners in the farm and seek ways to diversify and expand the operation as a way to elevate their status on the farm, and, finally, widows who have taken on the management of day-to-day operations (Brandth & Haugen, 2007; PAWomensAgNetwork, 2006). Each of these groups of women often lacks the business skills to make these enterprises profitable.
Extension in the south central region saw an educational opportunity to respond to the needs of these experienced and new farmer groups. Traditionally, Extension did not have to help farmers recognize and develop new agricultural enterprises or assist with the marketing of dairy, commodity, and orchard crops because these were used by the farmers themselves, sent to established markets or co-ops, or shipped to large local processing plants. However, in the face of many changes and challenges that exist in agriculture, Extension needed to develop a program to help both experienced and new farmers recognize and implement new value-added and marketing opportunities.
Extension in other states has faced the need for similar educational programming. Texas developed a business planning program for experienced farmers, although it was limited in that it did not include marketing nor did it target new farmer groups (Bennett & Bevers, 2003). In the Texas program Extension educators used workshops as the delivery method. Kentucky implemented a business development program for new entrepreneurs in rural areas, although it did not necessarily target farmers (Scorsone, 2003). In the Kentucky program, Extension educators facilitated interaction among community businesses, which then provided guidance to the new entrepreneurs. Maryland developed a program for new agricultural alternatives emphasizing those that were natural resource based (Kays, 1998). Extension educators used workshops, conferences, and farm visits as the delivery methods targeted for farmers and landowners. Although this program was discontinued, it provided the model for Pennsylvania to develop a program that used multiple delivery methods to reach various agricultural audiences and supported the changing landscape of the south central region.
Description of Program
In response to the new opportunities for experienced and new farmers of the south central region, Extension developed a comprehensive program. The program was funded by grant dollars received from the U.S. Department of Agriculture, the Pennsylvania Department of Agriculture, and Ben Franklin Technology Partners. An educator was hired to offer entrepreneurial assistance, business development, and agricultural enterprise programming. These services were provided through an array of delivery methods that included workshops at daylong conferences, an evening workshop series, and one-on-one consultation either at the farm or in the Extension office. The program covered aspects from numerous disciplines and was supported by educators in agronomy, horticulture, food science, livestock, business, and community and economic development. Specifically, the program was designed to:
- Increase the awareness of experienced and new farmers to new or potential enterprise opportunities.
- Assist experienced and new farmers in the development of comprehensive business plans, in order to decide whether to proceed with a new agricultural enterprise or continue exploring other enterprise options.
- Create opportunities where experienced and new farmers can engage in productive networking with other farmers with similar interests or enterprises and learn new marketing ideas.
- Increase agricultural profitability for experienced and new farmers and create new jobs for them in the agricultural community.
Evaluation
In 2005, the Income Opportunities Program marked the 2-year point of this program. Several farmers had moved forward with starting their business ventures, and others had decided not to start a new enterprise. It was an appropriate time to conduct a formative evaluation of the initial phase of the program and make any necessary programmatic changes if deemed necessary (Brown & Kiernan, 2001).
Methodology
To evaluate the program, a mail survey was created and sent to all of the current and previous program participants on the mailing list, a total of 241 at the time of the evaluation. A mail survey had several benefits over other evaluation tools. The first was that the mail survey required less labor and time. The second was that we needed to ask financial questions, and, according to Dillman (2000), people are more apt to answer these questions in this format.
The four-page survey was designed to measure the impact of the program in the following areas: number and types of new enterprises started due to the program; number of enterprises discontinued or not started; number of business plans developed and how they were utilized as a management tool; confidence in marketing methods; and marketing methods being utilized. The survey was also designed to measure the dollars invested and earned from the enterprises and the number of new full and part time jobs created. In addition, the survey determined any gaps in programming in terms of content or format.
Prior to the survey, the Institutional Review Board granted approval. Each participant was assigned a code so that as the completed surveys were returned, they were removed from the remaining list (Dillman, 2000). During weeks one and two, a request letter, the survey, a postmarked return envelope, and a postcard reminder were sent to all participants on the mailing list. During weeks three and four, a follow-up letter, another survey, a postmarked return envelope, and postcard reminder were sent to those who had not returned the survey.
Findings
By following the aforementioned process, a 53% return rate was established (N=120). The participant list was composed of 56% male and 44% female. The participants self identified into the groups of experienced farmers, new farmers, or neither. Experienced farmers comprised the majority of participants, with 67% having either large or small operations and looking to diversify. New farmers represented 19% of the participants, and 14% of participants did not identify themselves with either of the groups.
The first question identified an array of enterprises, and each respondent could check whether they had either "seriously considered" or "started" it since their involvement in the Income Opportunities Program. The list of enterprises fell into five categories that included livestock and fisheries, entertainment events, horticultural and other crops, retail operations, and value added.
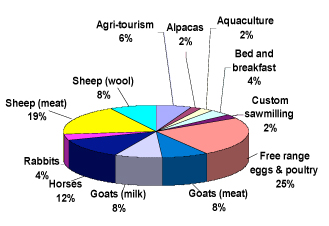
Participants reported that they "seriously considered" 309 new enterprises. From those that were "seriously considered," 154 new enterprises were "started." Figures 1 and 2 identify the percentages and types of enterprises started in horticultural, livestock, entertainment, and other categories.
Figure 1.
Percentage of Participants Who Started Horticultural
Enterprises as a Result of the Program (N=103)

Figure 2.
Percentage of Participants Who Started Livestock,
Entertainment, or Other Enterprises as a Result of the Program
(N=103)
The second question asked participants to identify when they planned to start a new enterprise (N=110). From this question, 28% of participants reported plans to start a new enterprise within the next 2 years. Of those who reported not starting a new enterprise, 37% of participants made the conscious decision not to start a new agricultural enterprise.
A third question asked if participants had discontinued an existing enterprise as a result of the program. Seven percent of participants discontinued their existing enterprise. These discontinued enterprises included a farm market and bakery, field corn and soybeans, apple farming, sheep, goats, and a large crop operation.
A series of questions were developed to assess the perceived importance of a business plan, the number who had created one or were in the process of creating a business plan, and how the information was being used to make decisions. Participants reported 20% completed the plan and 30% were in the process of creating the plan (N=114).
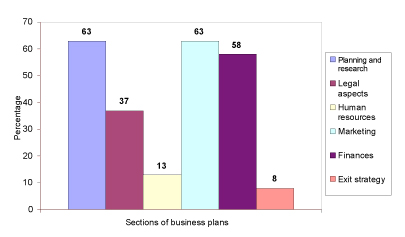
Another question, as seen in Figure 3, shows how participants utilized all the sections of the business plan when making decisions. Participants indicated they used three sections of the business plan the most in making business related decisions (N=83): planning and research (63%), marketing (63%), and finance (58%). Totals are more than 100% because participants were able to select all the sections used to make decisions.
Figure 3.
Percentage of Program Participants that Used Six Sections of a
Business Plan to Make Decisions Related to Their Agricultural
Enterprise (N=83)
Another question asked participants about their confidence in marketing their products (N=94). Thirty percent of participants reported that they were moderately or very confident about marketing their selected farm product before participating in the program. After participating in the program, 60% of participants reported they were moderately or very confident about marketing their selected farm product.
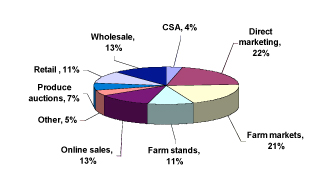
Participants also reported that they used new marketing methods. They include in the order in which they were most used: direct marketing, farm markets, online sales, wholesale, farm stands, retail, produce auctions, fundraising, restaurant sales, and community supported agriculture (CSA). Figure 4 represents the marketing methods used and the percentage of clientele using each of them as a result of the program.
Figure 4.
Percentage of Participants Who Used New Marketing Methods as a
Result of the Program (N=85)
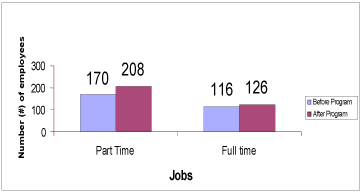
The final questions measured income, investment, and job creation. Participants were asked to identify the number of new full- and part-time jobs created with their new enterprises. Figure 5 shows the participant response to the number of part- and full-time jobs created as a result of participating in the program (N=89, 84). Participants reported the creation of 48 new full and part time jobs for their agricultural enterprises.
Figure 5.
Number of New Part- and Full-Time Jobs Before and After
Participating in the Income Opportunities Program (N=84 and
89)
Participants were asked to identify the amount of money invested in, and earned from, these new agricultural enterprises. The questions provided a scale of monetary ranges with the lowest $0-$1,000 and the highest over $500,000. As a result of the program, participants reported investing $929,936 into their new enterprises (N=68), with a collective gross income of $1, 019,941, or an average profit of $15,000 per farm (N=66).
Conclusions and Implications
The Income Opportunities for Rural Areas Program has recognized significant impacts for both experienced and new farmers. These farmers have gained new knowledge and made changes to their operations, such as starting a new agricultural enterprise or discontinuing an existing one. Many have developed business plans and, most important, used them as a decision-making tool. These farmers recognized and utilized new marketing methods. And these farmers invested in their new enterprises, created new jobs, and increased overall profitability.
In order to support the progress of experienced and new farmers towards profitability in regions of change, Extension must continue to initiate programs such as this one. Extension will continue to be faced with new challenges and new audiences as the landscape and agricultural community continue to evolve. These audiences may not be familiar with Extension as a resource. By being proactive, Extension can meet the educational needs of multiple agricultural audiences and provide networking opportunities between new and experienced farmers.
As in all studies, this study has limitations. The first is the 47% of participants who did not respond to the survey. Follow-up discussions pointed to several themes for non-completion. First, some farmers had not started a new enterprise and therefore did not feel that they had anything to report. Second, some farmers recently started a new enterprise, and, because they had not generated any income, they did not report. Most important, however, was that many of the nonrespondents had used the program to move ahead in their development of a new enterprise.
The second limitation is that half of the participants who responded to the evaluation elected not to answer a question. Although the participants were informed that this information was confidential and it would be reported in summary form, many did not share this sensitive information. But, through the one-on-one consultation, the educator learned the financial information quite readily from the participants.
The third limitation is that the numerical ranges in the questions for job creation, investment, and profit from the new agricultural enterprise led to an underreporting by those who did provide numbers. The maximum monetary investment or profit was the $500,000 category, and, in some cases, clientele earned more than that as a result of the program. In future evaluations, these ranges will be changed to categories that include smaller and larger figures.
Despite the limitations, the study reported here has several benefits. It demonstrates that with an Extension educator dedicated to a program to address the needs of a changing environment with challenges to new and established farmers, Extension can make a difference for those farmers. As a result of the formative evaluation of the Income Opportunities for Rural Areas program, Extension decided to continue the program for experienced and new farmers. While this program would be replicable in any rural area, there is also an opportunity for Extension in more metropolitan areas where there is an opportunity for market diversification and demand for local farm products.
References
Bennett, B., & Bevers, S. (2003). Developing a comprehensive business planning Extension program. Journal of Extension [On-line], 43(6). Available at: http://www.joe.org/joe/2003december/iw4.shtml
Brandth, B., & Haugen, M.S. (2007). Gendered work in family farm tourism. Journal of Comparative Family Studies. 38(2) 379-397.
Brown, J. L., & Kiernan, N.E. (2001). Assessing the subsequent effect of a formative evaluation on a program. Evaluation and Program Planning. 24(2) 129-143.
Dillman, D. A. (2000). Mail and Internet surveys: The tailored design method. New York: John Wiley & Sons., Inc.
Fannin, B. (2004). Two-part farm workshop targets family members returning to farm/ranch. Retrieved June 13, 2006, from: http://agnews.tamu.edu/dailynews/stories/AGEC/Aug1804a.htm
Franklin County Area Development Corporation. (2006). Why Franklin County? Retrieved September 13, 2006 from: http://www.fcadc.com/splash.htm
Hoffman, S., & Norton, D. (2005). 2002 Census Reveals and Increase in Women Principal Operators. USDA Newsroom. Retrieved October 26, 2007 from: http://www.nass.usda.gov/Newsroom/2005/03_09_2005.asp
Huff, K. (2005). Students cultivate education before returning to the farm. Iowa State Daily. Retrieved June 13, 2006, from: http://www.iowastatedaily.com/media/storage/paper818/news/2005/01/25/Agriculture /Students.Cultivate.Education.Before.Returning.To.The.Farm- 1102906.shtml
Kays, J. (1998). Improving the success of natural resource-based enterprises. Paper presented at the North American Conference on Enterprise Development through Agroforestry: Farming the Agroforest for Specialty Products, Minneapolis, MN.
National Agricultural Statistics Service. (2005). Farms, land in farms and value. Pennsylvania Agricultural Statistics 2004-2005. (tp. 13-14).
Orr, D. (2006). The cheap gourmet. Forbes,177(7), 1.
Pennsylvania Women in Agriculture Network Research Group (PAWAgN). (2006). Unpublished data. Reviewed on May 1, 2006.
Radke, L. (2006). A new crop of farmers. Centre Daily Times. 30 April, (p. E7).
Scorsone, E. (2003). Encouraging entrepreneurship in rural communities: The University of Kentucky Entrepreneurship Initiative Program. Journal of Extension [On-line], 41(6). Available at: http://www.joe.org/joe/2003december/iw5.shtml
U.S. Census Bureau. (2006). 2005 American Community Survey. Retrieved September 13, 2006 from: http://factfinder.census.gov/
U.S. Census Bureau. (2006). Population division. Table 4: Annual estimates of housing units for counties in PA: April 1, 2000 to July 1, 2005. (HU-EST 2005-04-42). Retrieved September 13, 2006, from: http://www.census.gov/popest/housing/tables/HU-EST2005-04-42.xls.
Women in Agriculture. (2007). Retrieved October 26, 2007 from: http://www.csrees.usda.gov/nea/economics/in_focus/small_business_if_women.html