April 2008 // Volume 46 // Number 2 // Research in Brief // 2RIB4
An Exploratory Study of Farmers' View on Aquaculture Development in Indiana
Abstract
The study reported here involved a mail survey of Indiana aquaculture producers to determine the level of Indiana aquaculture and what producers thought were constraints to aquaculture development. Aquaculture is a minor part of Indiana's agricultural economy. Suggested constraints were generally ranked as significant, but the top three constraints were identified as high start-up costs, lack of well-established market for aquaculture products, and high costs of day-to-day operations. Consequently, research and Extension programming has focused on funding aquaculture businesses, analyzing market potential, assessing aquaculture's place in the general seafood industry, and developing value-added aquaculture products.
Introduction
In 1998, a number of individuals from the Indiana Aquaculture Association, Indiana state government, and Purdue University developed the "Indiana Aquaculture Plan," designed to offer insights into Indiana's aquaculture industry and describe various methods of production, species suitable for culture, regulatory policies, marketing strategies, information on financing aquaculture operations, and management of fish culture facilities (Reed & Isaacs, 1998). The primary goal of the plan was to assist planning efforts for Indiana's aquaculture development.
The first USDA aquaculture census in 1998 reported 24 aquaculture farms in Indiana, with a sales value of $2.7 million (USDA-NASS, 2000). By 2002, the number of farms had increased to 47, with a sales value of $3.2 million (USDA-NASS, 2004), indicating an increase, but this is relatively low compared to neighboring states. In Ohio, for example, the number of aquaculture farms in 2002 was 100, with a sales value of $3.3 million, compared to 33 farms and a sales value of $1.8 million in 1998 (USDA-NASS, 2002, 2004).
Undoubtedly, there is increased interest in aquaculture in the Midwest and the North Central region, but the growth of the industry has generally been slow compared to growth in other parts of the nation, particularly in the South. The South accounts for about 70% of the total value of U.S. aquaculture products sold, compared to 3% for the North Central region (USDA-NASS, 2004). Climatic conditions in the South favor outdoor pond culture, which is relatively cheaper than other production methods. In Indiana, about 50% of aquaculture production occurs in ponds and the rest in cages and re-circulating systems (USDA-NASS, 2000).
Purpose
The purpose of the study reported here was to assess Indiana aquaculture and determine what producers thought were hindrances to its development in the state.
Methodology
The study involved a mail survey to Indiana aquaculture producers in 2005. The list of producers was obtained from the Indiana Department of Natural Resources and the Indiana Aquaculture Association, Inc. The questionnaire solicited information on number of years in the aquaculture business, income from aquaculture and allied industries, type of operation, species reared, product forms, and marketing strategies. A second section asked respondents to rank a series of 11 statements relating to what they believed to be constraints to the development of aquaculture in Indiana. These statements were developed from discussions with the Indiana Aquaculture Association, Inc.
The survey questionnaire was pre-tested. Responses from the pre-test were used to develop the final survey instrument. The mail survey was used because of its relatively lower cost compared to other data collection methods, and it provided thoughtful responses that could be analyzed statistically.
There were three mailings to every contact name from the list: an introductory postcard, the survey and cover letter, and a reminder/thank you notice. Two additional mailings including a cover letter and survey were sent to non-respondents of the initial mailings. A test-retest method was adopted to check the reliability of survey responses. Three respondents were contacted in 2006 asking them to rank again the 11 statements relating to constraints to Indiana aquaculture development. The correlation coefficient between the two sets of responses was 0.93.
Results and Discussion
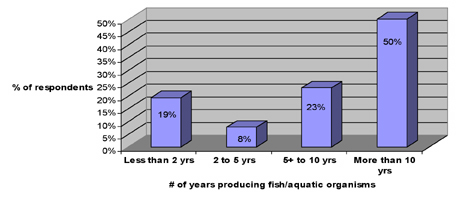
A response rate of 42% was obtained (38 out of 91 contacts responded). Twenty-three of the 38 who responded were actively involved in aquaculture production. Most (73%) had been in aquaculture for at least 5 years (Figure 1). This level of experience of respondents could be beneficial to learning about constraints to aquaculture development in the state.
The results presented here must be interpreted with some caution because of the sample size and the response rate. However, given that the 2002 USDA agricultural census indicated 47 Indiana aquaculture farms, responses from 23 producers are a good representative sample of producers and what they perceived as significant constraints to the development of the industry in the state. Most Indiana operations are for food fish production and recreational or sports fishing.
Figure 1.
Percentage of Responses by Years
Producing Fish/Aquatic Organisms
Level of Indiana Aquaculture
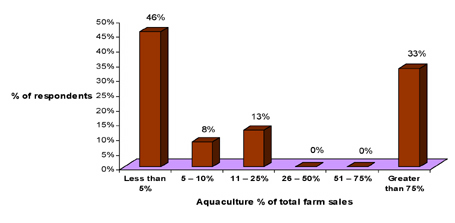
The level of Indiana aquaculture production is generally low (Figure 2). Over 84% of respondents produce at most 10,000lb of aquaculture products a year. It suggests aquaculture is a minor part of Indiana's agricultural production. Most operations are part-time business ventures. This agrees with Figure 3, which shows that aquaculture constituted at most 25% of total agricultural sales for 67% of respondents (Figure 3). It confirms that the level of production in the state is largely small-scale.
There are a few producers in the state who produce quite substantial amounts of aquaculture products. About 12% of respondents reported total gross sales estimates from aquaculture and allied activities of over $100,000 in the 2004/2005 farming season. These producers are among the 8% reported in Figure 2 who produced from 50,001-100,00lb. They are also among the respondents who indicated aquaculture accounts for at least 75% of total gross farm sales (Figure 3). Allied aquaculture activities include fee fishing operations, design and sale of aquaculture equipment, sale of other inputs, and management/consulting services.
Figure 2.
Percentage of Responses by
Category of Production Levels
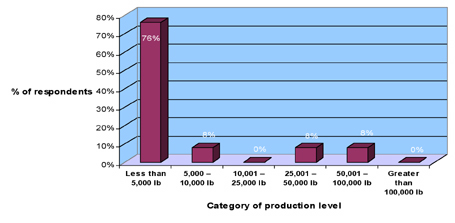
Figure 3.
Percentage of Responses by
Aquaculture Percentage of Total Gross Farm Sales
Constraints to Development
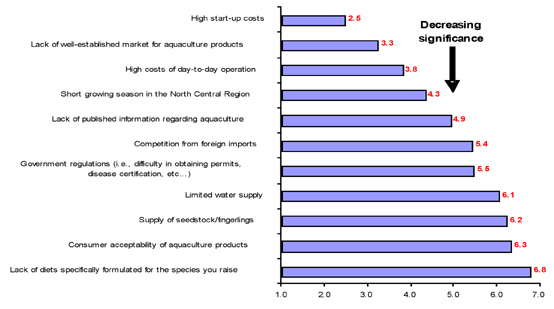
Respondents were asked to rank 11 constraints in terms of significance to aquaculture development in Indiana (where 1 is the most significant and 11 is the least significant). Figure 4 presents the average ranking for the suggested constraints. Overall, it appears from Figure 4 that no single factor constituted a major constraint, but rather, several factors need to be addressed if Indiana aquaculture is to develop. The average rankings reported in Figure 4 are all below 7 in a scale of 1 – 11, suggesting that no individual constraint was ranked consistently low in terms of significance.
However, the top three constraints to aquaculture development were identified as high start-up costs, lack of well-established market for aquaculture products, and high costs of day-to-day operations. These constraints relate to economics and management of aquaculture enterprises, which is consistent with previous assessment of the industry. In a 2004 fact sheet, The Midwest Is Hungry for Aquaculture, the Illinois-Indiana Sea Grant College program reported that economics and marketing were key factors to proceeding beyond the region's crossroad in aquaculture development (IISG, 2004).
Figure 4.
Average Ranking of Constraints
Findings from the study suggested a course of action involving programming and policy that will help address economics and marketing issues confronting aquaculture. Currently, the level of investment in aquaculture by commercial lending institutions in Indiana is either minimal or nonexistent. Consequently, Purdue University aquaculture applied research and Extension programs have focused on aquaculture business development, analysis of market potential, assessment of aquaculture's place in the general seafood industry, and development of value-added aquaculture products. One major focus of Extension programming for the industry is educating financial lending institutions on the economic potential of aquaculture, exploring the services of the agriculture insurance industry in aquaculture, and exploring investment capital for aquaculture development. It is hoped that these efforts will provide a promising platform for expanding aquaculture in the region.
Conclusions and Implications
The level of aquaculture production in Indiana is largely small-scale. Several constraints plague the industry's development, particularly issues related to economics and management of aquaculture enterprises. The approach adopted by Purdue Extension to helping aquaculture develop has primarily focused on funding sources for aquaculture businesses, analyzing market potential, assessing aquaculture's place in the general seafood market, and developing value-added aquaculture products. Recent county aquaculture workshops emphasizing economics of production and marketing have played a major role in helping to address these constraints.
Aquaculture is considered an alternative to traditional agriculture in Indiana, and it is likely that some minor fruits and vegetable industries have similar constraints. Consequently, the form of assistance to Indiana's alternative agriculture enterprises should be from a holistic perspective to address issues that include financing, economics, marketing, policy, science, and technology transfer. In particular, financial lending institutions in the region should be educated in these forms of agricultural enterprise.
Aquaculture Extension staff and state agricultural officials can use the findings from this study to strengthen subject matter of their programs geared toward alternative agriculture development.
Acknowledgements
Funding for this research was provided by The Office of the Commissioner of Agriculture, Indiana (now Indiana State Department of Agriculture) through the value-added research program.
References
Illinois-Indiana Sea Grant Program. (2004). Illinois-Indiana Sea Grant: Impacts – The Midwest is Hungry for aquaculture, Publication # IISG-04-04. Retrieved April 14, 2008 from: http://www.iisgcp.org/products/program/ImpactsAQ0420.pdf
Reed, C., & Isaacs, D. (1998). The Indiana aquaculture plan. Retrieved April 14, 2008 from: http://aquanic.org/publicat/state/il-in/inplan.pdf
USDA-National Agricultural Statistics, NASS (2000). 1997 Census of Agriculture AC97-SP-3, Census of Aquaculture (1998), Vol. 3, Special Studies Part 3. Retrieved April 14, 2008 from: http://www.nass.usda.gov/census/census97/aquaculture/table1.pdf
USDA-National Agricultural Statistics, NASS (2004). 2002 Census of Agriculture AC-02-A-51, Volume 1, Geographic Area Series Part 51. Retrieved April 14, 2008 from: http://www.nass.usda.gov/census/census02/volume1/us/st99_2_002_002.pdf