December 2007 // Volume 45 // Number 6 // Feature Articles // 6FEA4
Research to Action: A Campus-Community Partnership to Address Health Issues of the Food Insecure
Abstract
A university-community partnership assessed the food security and health status of food pantry participants in a midwestern urban community. Eighty percent of households surveyed were food insecure, and 40% experienced fair or poor health. The sample experienced higher rates of chronic disease than the general population. A nutrition education program designed to meet specific nutrition and health-related needs of pantry participants was developed. Implications include training pantry staff about chronic disease and its relationship to nutrition, identifying pantry foods that provide positive health benefits, and developing consumer publications focused on selecting and preparing pantry foods when one has chronic disease.
Introduction
Cooperative Extension values grass roots identification of public needs and interests as the basis for local programming. Across the U.S., Extension educators link the resources of over 100 land-grant universities and colleges to the needs of communities (CSREES, 2006). Perry Holden, the founder of Cooperative Extension in Iowa, once said, "Our endowed and state universities and colleges and high schools will do more than wait for the pupils to come to them. They will go out to the farm and factories and mines and homes and slums to serve humanity in order to build a greater Iowa" (Iowa State University Library, University Archives, p. 7).
Community-based Extension educators communicate local issues and problems to campus-based Extension faculty. Together, they conduct community-based research in order to design educational programs that address local needs.
In this article, we describe a partnership among a local community, an Extension educator, and campus-based Extension and non-Extension faculty. The team assessed the food insecurity and health of a defined community population (i.e., food pantry participants), shared the results with local partners, and then obtained funding for an education program designed to meet specific nutritional and health-related needs of food pantry participants.
Importance of the Project
Between 22-25 million people (9 million children; 3 million seniors) in the U.S. received food from food pantries in 2005. Families who go to food pantries are among the most vulnerable people in communities and often lack financial and social resources to solve food and health problems. They continually face choices between food and housing, utilities, and health care (Hunger in America, 2006). While food pantries meet some of their needs, many of the foods offered are low in vitamins (e.g., A, C) and minerals (e.g., calcium) that are essential for good health (Akobundu, Cohen, Laus, Schulte, & Soussloff, 2004), thus placing families at risk for nutritional deficiencies (Tarasuk et al., 1998).
Of the 8.6 million households served by the America's Second Harvest (A2H) food pantries in 2005, over 6 million (70%) experienced food insecurity (Hunger in America, 2006). That is, they experienced times during the year in which their access to enough food was limited due to a lack of money and other resources (Life Sciences Research Organization, 1990). This is in comparison to a food insecurity rate of 11% in 2005 for all U.S. households (Nord, Andrews, & Carlson, 2006).
Individuals who experience food insecurity are at increased risk for developing chronic diseases such as cancer and heart disease, as they typically do not consume the recommended number of servings of vegetables and fruits (ADA, 2002). The risk of heart disease is more than 25% higher for persons with low incomes than for the overall population, and the incidence of cancer and the prevalence of hypertension and obesity vary inversely with socioeconomic status. Iron deficiency is more than twice as common among children from low-income families compared to children in the total population (U.S.D.A. Foreign Agricultural Service, 1998).
The consequences of being food insecure are numerous. Chronic diseases and health issues have contributed to soaring health care costs that have been absorbed by U.S. citizens who have health care insurance, as well as by the U.S. public through taxes. Poor health also limits the ability of people to be active, contributing community members and effectively care for, nurture and guide their children (Smith, Cudaback, Goddard, & Myers-Walls, 1994).
Adults who are well nourished have fewer chronic health issues than those who are not well nourished, and are more likely to engage in and contribute to their communities. Children who are adequately nourished perform better academically and socially than those who are not well nourished. Children who have difficulty learning and getting along with others are less employable later as adults (Braun, 1997).
Thus, food insecurity affects not only the mental and physical health and behavior of individuals, but it also impacts the economic welfare of communities. Historically, and increasingly Cooperative Extension is involved in economic development efforts in communities across the U.S.
Understanding the circumstances under which families who visit food pantries live is vital to addressing many of the problems that permeate U.S. communities. Given their increased risk of chronic disease, and that the foods available at food pantries are often low in essential vitamins and minerals, families who are food insecure, have low incomes, and who access food at food pantries could benefit from participating in nutrition education programs (Akobundu, Cohen, Laus, Schulte, & Soussloff, 2004).
With exposure to nutrition education, participants can use foods available at pantries and from other sources to create safe and nutritious meals that meet recommended daily servings for their families. Cooperative Extension, with its local presence, direct ties to the land-grant university system, and capacity for research, is uniquely positioned to strengthen society's ability to address critical family issues such as food insecurity through research, education, and community development.
Project Overview
Des Moines is the capital of Iowa and the county seat for Polk County. It has the largest population (194,311 people in 2004) in the state (Census Bureau, 2006). According to the U.S. Current Population Survey, Iowa is more food secure (89.1% of households) than the nation as a whole (88.6%) (Nord et al., 2006). However, when selected inter-city neighborhoods in Des Moines are surveyed, the concern for food insecurity is larger. For example, a random survey of a Des Moines central city neighborhood revealed that 79% of those who responded lived in a food insecure household (Morton, Oakland, Bitto, & Sand, 2003). Thus, food security at the local level can appear very different from food security at the national and state levels.
In an effort to design and deliver nutrition education to meet the needs of inner city residents of Des Moines, Iowa State University Extension (ISUE) invited the Des Moines Area Religious Council (DMARC) to participate in a food insecurity and health survey at each of the food pantries in the county. DMARC is an interfaith organization whose purpose is to provide a common means of responding to basic human needs in ways beyond the abilities of single congregations (DMARC, 2007). DMARC also provides a context for interfaith dialogue, support, education, and fellowship as it is a liaison between over 150 member congregations and the greater Des Moines area community. DMARC provides leadership for eight local food pantries that provide emergency food packages to over 3,000 families and individuals monthly in Des Moines and the surrounding area.
Methods
The project is the continuation of efforts to assess the extent of food insecurity in local communities (Greder, Garasky, Jensen, & Morton, 2002). Earlier studies focused on how the local food environment affects household food insecurity across a range of communities in Iowa (Garasky et al., 2004). The survey instrument employed for that project captured broadly the conditions under which food pantry clients attempted to meet the nutritional needs of members of their households. More specifically, respondents were queried about their: (1) food security, (2) access to the normal food system and community food resources, (3) participation in assistance programs, (4) amounts and sources of income, (5) employment, and (6) personal characteristics. That instrument was modified for the reported here study by including questions about the health of household members.
The purpose of the survey was to obtain information that would reflect changes over time in household food security and the health status of household members. Food pantry staff distributed a four-page questionnaire to adults who accessed food at eight pantry sites in Polk County, Iowa, during March/April, 2004. Three thousand surveys were distributed to food pantries to be shared with individuals who came to the pantries. Completed surveys were received from 997 individuals.
Regarding food security, the survey instrument included six questions about behaviors and experiences known to typify households under pressure to meet their food needs (Bickel, Nord, Price, Hamilton, & Cook, 2000; Nord, 2003; Nord & Andrews, 1999). These questions were developed by the USDA to provide a standardized assessment of household food security along a continuum that can be divided into three ranges: food secure, food insecure without hunger, and food insecure with hunger. Using this standardized assessment tool allows researchers to compare results across populations and over time.
Table 1 provides a listing of the food security questions. The first response category for each question was considered an affirmative ("yes") for computing the respondent's food security scale value. If a respondent answered "no" to the stem question (Q3), a "no" response was inferred to complete the follow-up questions (Q4-Q6). The resulting scale values for the "yes" responses were:
- Food secure--0 to 1 questions;
- Food insecure without hunger--2 to 4 questions; and
- Food insecure with hunger--5 to 6 questions.
| Response | ||
| Research Question | Percent | Cumulative |
| Q1 The food that (I/we) bought just didn't last and (I/we) didn't have money to get more. | ||
| Often or sometimes true | 90.5 | |
| Never true | 9.5 | 100.0 |
| Q2 (I/we) couldn't afford to eat balanced meals | ||
| Often or sometimes true | 86.7 | |
| Never true | 13.3 | 100.0 |
| Q3 In the last 12 months did (you/you or other adults in your household) ever cut the size of your meals because there wasn't enough food to eat? | ||
| Yes | 70.1 | |
| No | 29.9 | 100.0 |
| Q4 If yes to Q3, how often did this happen? | ||
| Almost every month or some months but not every month | 82.9 | |
| In only 1 or 2 months | 17.1 | 100.0 |
| Q5 If yes to Q3, in the last 12 months, did you ever eat less than you felt you should have because there wasn't enough money to buy food? | ||
| Yes | 79.3 | |
| No | 20.7 | 100.0 |
| Q6 If yes to Q3, in the last 12 months, were you ever hungry but didn't eat because you couldn't afford enough food? | ||
| Yes | 66.9 | |
| No | 33.1 | 100.0 |
| Food secure | 12.1% | |
| Food insecure without hunger | 28.4% | |
| Food insecure with hunger | 59.5% | |
| N=927; 70 respondents did not answer enough food security questions to calculate an index value. | ||
Results
Demographics
Slightly more of the respondents were female (53.4%) than were male (46.6%). The median age of the respondents was 41 years. On average, each responding household had 2.5 members, although 42.4% of the respondents lived alone. A similar share of households (43.1%) had two-four members. The remaining households (14.5%) had five or more persons, with a maximum of 12 members. Less than 3% (2.7%) of the respondent households had a member who was age 65 or over; 16.7% of the households had a child under age 5. Respondents typically had limited education. Almost half in this sample (45.2%) did not receive a high school diploma.
Income and Employment
These households also had low incomes. The median reported household income was $750 per month. Almost half (41.8%) of the respondents reported monthly household incomes of less than $500. Only 6.4% of the household reported incomes over $1,500 each month, or annualized over $18,000 each year.
Most survey respondents (74.0%) were not working at the time of the survey. Furthermore, almost half reported not working in at least the previous 12 months (38.9%) or never having worked (10.0%). Wages were low among working respondents. One-third (30.1%) reported wages of $6.00 per hour or less. Only 10.3% reported earning over $10.00 per hour. Among those working, over half (62.4%) worked at least 21 hours each week, and 23.7% worked 40 or more hours per week. Only 15.0% of the respondents reported someone else in the household worked.
Food Pantry Usage
Food pantry usage was common among this sample of food pantry participants. More than one-third (36.6%) of the survey respondents reported that they visited a food pantry seven or more times in the last 12 months. A similar percentage of the respondents (41.5%) visited food pantries three or fewer times.
Household Food Security
Using the USDA food security scale and continuum, 12% of the respondents reported that their household was food secure. The remaining households (88%) were food insecure: 28% were food insecure without hunger, and 60% were food insecure with hunger. Over half of the respondents reported that in the last 12 months it was sometimes (41.2%) or often (13.7%) that there was not enough food to eat in their household. Similarly, more than 90% of the respondents said that it was often (32.1%) or sometimes (58.4%) that the food bought just did not last and that there was no money to get more food. Again, most households indicated that they often (28.0%) or sometimes (58.7%) could not afford to eat balanced meals.
The pattern continued for other indicators of food insecurity. Seventy percent of the responding households included one or more adult(s) who cut meal sizes or skipped meals in the last 12 months because there was not enough money for food. For about half of these respondents, this happened almost every month. Similarly, among the respondents reporting someone in the household cut or skipped meals, about 80% (79.3%) said that in the last 12 months they ate less than they felt they should because there was not enough money to buy food, and two-thirds (66.9%) were hungry, but did not eat because they could not afford enough food.
Assistance Program Participation
Food Stamp Program (FSP) participation was common among survey respondents (79.5%), and approximately one-third reported currently being program participants (Table 2). The majority of respondents had not participated in the Family Investment Program (FIP), Iowa's Temporary Assistance to Needy Families (TANF) program. More than two-thirds (69.3%) of the respondents had never received FIP benefits. Only 7.1% were current FIP participants.
| Participation (%) | ||
| Usage | FSP | FIP |
| Presently using | 37.5 | 7.1 |
| Have used in past (not now) | 42.0 | 23.6 |
| Never used | 20.5 | 69.3 |
| Total | 100.0 | 100.0 |
Health of Household Members
Participants also were asked to assess their general health status (Table 3). Slightly more than one-fourth of the participants reported that their health was excellent (10.5%) or very good (17.6%). The percentage of participants who reported that their health was fair or poor was 40.5%.
| Status | Percentage |
| Excellent | 10.5 |
| Very good | 17.6 |
| Good | 31.4 |
| Fair | 29.0 |
| Poor | 11.5 |
| Total | 100.0 |
The survey included a series of questions regarding chronic disease. The chronic disease questions were the same as found in the Behavioral Risk Factor Surveillance System (BRFSS) and Selected Metropolitan/Micropolitan Area Risk Trends (SMART) for comparison to the food pantry respondents. Survey results were compared with national, state, and county statistics (Table 4.)
Regarding specific ailments, 24.3% of the respondents reported that someone in their household had been told by a health professional that they had diabetes. Seventeen percent of the households had someone with heart disease. Approximately one-third of the households had someone with high blood pressure (32.9%), asthma (29.0%), or allergies (33.8%).
The prevalence of health conditions was comparatively similar regarding food security status. If anything, food secure households are slightly more likely to report that someone has been told by a health professional that they have a particular ailment. Perhaps this result is due to food secure households being more likely to see health professionals when health problems arise. Thus, we may not know the extent of chronic disease among food insecure households if they are not likely to go to health professionals.
| Prevalence (%) | ||||
| Chronic Disease | National | State (Iowa) | County2 (Polk) | Local Food Pantries1 |
| Diabetes | ||||
| Myself | 7.25 | 6.85 | 5.5 | 14.2 |
| A Family member | 11.7 | |||
| Myself and a family member | 24.3 | |||
| Heart Disease | ||||
| Myself | 4.14 | NA | 9.5 | |
| A Family member | 8.0 | |||
| Myself and a family member | 7.16 | 17.0 | ||
| High Blood Pressure | ||||
| Myself | 24.85 | 25.1 | NA | 24.2 |
| A Family member | 11.9 | |||
| Myself and a family member | 32.9 | |||
| Asthma | ||||
| Myself | 7.73 | 6.23 | 10.7 | 18.6 |
| A Family member | 14.7 | |||
| Myself and a family member | 29.0 | |||
| Allergies | ||||
| Myself | 24.7 | |||
| A Family member | 16.2 | |||
| Myself and a family member | 33.8 | |||
| 1. Survey administered in March
and April 2004 at food pantries in Polk County. 2. Center for Disease Control and Health Promotion Data for Selected Metropolitan/Micropolitan Area Risk Trends. 2004. Retrieved May, 2006 from http://apps.nccd.cdc.gov/brfss-smart/ 3. Center for Disease Control and Health Promotion Lifetime Prevalence Rate. 2004. Retrieved May, 2005, from http://www.cdc.gov/asthma/brfss/04/lifetime/lifetime.pdf 4. Center for Disease Control and Health Promotion Behavioral Risk Factor Surveillance System. 2000. Retrieved May, 2005, from http://www.cdc.gov/brfss/ 5. Center for Disease Control and Health Promotion Behavioral Risk Factor Surveillance System. 2005. Retrieved May, 2006, from http://www.cdc.gov/brfss/ 6. Tufts University Newsletter. Sept., 2004. Ernst J. Schaefer, M.D. | ||||
Application of the Results
To plan meaningful educational programs, it was important to look at specific population needs. The incidence of chronic diseases was more common among food pantry participants who completed the survey than among the general Polk County population. The incidence of diabetes, however, was considerably higher (almost three times) among the food pantry participants compared to the general Polk County population.
Based on these findings, ISUE and Primary Health Care, Inc. (PHC), an organization in Des Moines that offers medical services to uninsured or under-insured people, determined they would create a partnership (Figure 1) to provide treatment and education to people newly diagnosed with diabetes who receive food from the DMARC food pantries. To pilot this project, several grant applications were submitted including applications to the U.S. Department of Health and Human Services, local foundations, and non-profit organizations. The local county health department funded the first workshop, which was held in May and June, 2006.
Figure 1.
Circle of Diabetes Support in
Making Connection Neighborhoods
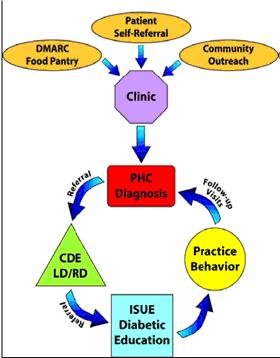
PHC promoted the workshops to potential participants and provided: (a) staff for screening, (b) screening materials, (c) a registered/licensed dietician, and (d) follow-up visits with medical staff. ISUE staff analyzed the diabetes screening tool, developed promotional flyers, provided instruction during the workshops, and provided participants with general nutrition counseling.
The goals of this partnership included:
- Screening 300 community food pantry participants using the American Diabetes Association (ADA) risk screening tool. Individuals with elevated risk for diabetes were referred to PHC for diagnosis. Outreach workers from PHC used the ADA seven-point questionnaire to encourage participants to seek further analysis of their diabetes profile at PHC clinics. Persons who had a score higher than 10 were invited to a meeting to learn more about the project and to have a blood screen for diabetes.
- Offering 15 newly diagnosed diabetic patients consultation with a dietician and participation in a four-part workshop on managing diabetes. The 15 patients will be tracked by the Diabetes Collaboration project through PHC to evaluate their "tight control" of their diabetic condition.
Screened individuals were invited to participate in a series of four 2-hour classes after they received a diabetic diet plan from the community dietician. The Healthy Diabetes Plate curriculum (Raidl, 2003) was used to visually teach participants the types and amounts of food they should consume using the My Pyramid (USDA, April, 2005). This curriculum was piloted in Idaho, Oregon, and Colorado by Extension educators and registered dietitians, and reviewed by certified diabetes educators for technical accuracy.
Progress to Date
The American Diabetes Association diabetes risk-screening tool was used to screen 303 food pantry recipients. A score of 10 or higher indicates that a person is at greater risk for having diabetes. One hundred and forty-six (52%) of the 279 screens completed in English scored over 10 points; 7 (29%) of the 24 screens completed in Spanish scored over 10 points. Individuals with scores over 10 were invited to an introductory meeting that includes a fast screening and a food recall. Seventeen of the 116 participants with scores above 10 indicated they would like to participate. At an informational meeting 15 participants had a blood glucose screen and were found to not be diabetic.
The diabetes screening survey at the food pantry disclosed that 57.25% (n=158) of the English speaking participants were overweight or obese--a leading contributor to diabetes. Seventy-five percent (n=18) of Spanish speaking participants and 52% (n=144) of the English speaking participants were under the age of 45. Combining the statistics of age and the incidence of diabetes reveals potential for the early on-set of diabetes. These additional findings supported the decision to move forward with conducting the workshop series as a means for pre-diabetic education.
Using the workshop goals and key concepts found in The Healthy Diabetes Plate curriculum (Riadl, 2003), a list of 20 supportive behaviors was used to create a pre- and post-test survey. The participants (N=8 completing the survey) overall improved their eating behaviors from an average of six recommended behaviors to 14 recommended behaviors. The two most improved eating behaviors were eating at least one fruit at each meal and choosing main dishes with more vegetables when eating away from home.
Following the first series of workshops, five more workshop series have been organized by the original food pantry group, including senior citizen programs, churches, and community center sites.
Conclusions and Implications for Extension
The project reported here illustrates how campus-based university staff collaborated with Extension field staff to use community-specific data to define specific health related needs, set priorities, and provide education that makes a difference in the lives of extension clients.
Many respondents had low educational attainment, relatively few respondents worked, and those who worked had received low wages. As a result, respondent households had little income. Some households subsidized their income with food stamp benefits. Few received cash welfare. Food pantry usage was common as families attempted to meet their food and nutritional needs. Unfortunately, few families in this survey were successful in obtaining enough food for all family members. Most respondent households were food insecure; more than half were food insecure with hunger.
The health of the members of these families was also a problem. Forty percent of the respondents reported their personal health was either fair or poor. Between one-fourth and one-third of the surveyed households had members with diabetes, high blood pressure, asthma, and/or allergies.
As a result of the findings of the study, Extension field staff creatively partnered with a local health agency to design a nutrition education workshop series to target a specific health related need of these families. The first example of this partnership was a workshop series focused on Type II Diabetes. Data collected before, during, and after the workshop series was used to analyze the effectiveness of the nutrition education intervention, as well as explore additional opportunities to educate families on other identified health issues (e.g., high blood pressure, asthma, allergies).
Phone calls to potential participants of the pre-diabetes education workshop series revealed that some potential participants were very interested in addressing their health concerns and ready to learn, while others were less excited to do so. This population faces multiple challenges including poverty and food insecurity (Garasky et al., 2004; Morton et al., 2003; Greder et al, 2002). Addressing their health concerns (i.e., potential for developing diabetes) is not necessarily at the top of their priority list. This is especially true of health issues that are chronic, but not at the acute stage. Even when barriers are considered, survey participants were not likely to set aside time to improve lifestyle behaviors (e.g., diet, exercise) due to their realities of food insecurity and hunger.
Analysis of data from the post workshop evaluations indicated the following:
- Participation in the workshops would increase if the workshops were held when and where the target audience already gathers.
- Participating in a separate workshop series may not be feasible for all food pantry participants. Blood glucose screens and mini-education sessions (5-10 min) must be available on-site at food pantries. Referrals could be made to health care professionals such as individuals who make up the PHC Diabetes Collaborative.
Even though there were 20 African Americans who scored 10 or higher on the diabetes screening tool and were invited to the informational meeting, no African Americans came to the meeting. When additional workshops were held in communities in Des Moines that had a high population of minorities, the workshops were well received. The participants at the senior centers asked to have additional diabetes classes. Thus, as revealed in the data from the post-workshop evaluations, to reach this audience, one needs to go where the audience regularly convenes.
Last, but not least, until a personal relationship is established with members of the target audience who often do not have a history of accessing Extension resources or participating in organized educational sessions, the majority of people will not readily follow through on behavior changes. In order to develop trust and rapport, Extension staff need to learn how to develop relationships with members of communities they serve and not necessarily reside in.
Given the prevalence of chronic disease among food pantry participants and its social and economic cost to society, and Extension's historic and current role in nutrition, health, and economic development, it is fitting for Extension staff to become involved in addressing food insecurity and hunger. One very tangible way for Extension to be involved in this issue is for Extension to tailor nutrition and health education to meet the specific needs of food pantry participants.
Examples of specific ways to tailor educational programming include training food pantry staff and volunteers about the special health issues many food pantry participants experience and helping them identify foods that provide positive health benefits, as well as foods that are high in nutrients (e.g., sodium and fat) that are not healthy choices. In addition, Extension staff, in partnership with a public health agency, could develop brief publications that contain information that individuals with chronic diseases such as heart disease, high blood pressure, diabetes, etc., need to consider when selecting and preparing common foods distributed at food pantries.
Findings from the study reported here should be of interest to community organizations that serve low income populations, local government that is charged with safeguarding the well-fare of its citizens, Extension field staff (including Expanded Food and Nutrition Education Program [EFNEP] and Food Stamp Nutrition Education Program [FSNEP] staff), and university researchers interested in family well-being.
Extension staff in other states could partner with community organizations and university researchers to replicate the study with particular populations they serve, including low income families who participate in FSNEP and FNP and families who go to food pantries, as well as specific neighborhoods or areas of a county. Such research can help to assess the extent of chronic disease among identified populations to project future health care needs and costs, as well as to determine if their current nutrition education information and messages should be modified to meet specific health needs of families in the community.
References
Akobundu, U. O., Cohen, N. L., Laus, M. J., Schulte, M. J., & Soussloff, M. N. (2004). Vitamins A and C, calcium, fruit, and dairy products are limited in food pantries. Journal of the American Dietetic Association, 104, 811-813.
American Dietetic Association (ADA). (2002). Position of the American Dietetic Association: Domestic food and nutrition policy. Journal of the American Dietetic Association, 102, 1840-1947.
Bickel, G., Nord, M., Price, C., Hamilton, W.L., & Cook, J. T. (2000). Guide to measuring house-hold food security, revised 2000. Washington, DC: U.S. Department of Agriculture, Food and Nutrition Service.
Braun, B. (Feb, 1997). From welfare to wellbeing nutrition education: A strategy in welfare reform. Presented at the Nutrition Education for Diverse Audiences Conference. Houston, TX. Retrieved March 6, 2007, from http://www.extension.umn.edu/distribution/businessmanagement/DF6897.html
Census Bureau, U.S. (2006). Population estimates. Retrieved May 22, 2006, from http://www.census.gov/popest/estimates.php
Center for Disease Control and Health Promotion Behavioral Risk Factor Surveillance System. (2000). Retrieved May, 2005, from http://www.cdc.gov/brfss/
Center for Disease Control and Health Promotion Data for Selected Metropolitan/Micropolitan Area Risk Trends. 2004. Retrieved May, 2006 from http://apps.nccd.cdc.gov/brfss-smart/
Cooperative State Research, Education, and Extension Service (CSREES). (2006). Retrieved June 2, 2006, from http://www.csrees.usda.gov/qlinks/extension.html
DMARC. (2007). Des Moines Area Religious Council. Retrieved March 22, 2007, from http://www.dmreligious.org/
Garasky, S., Morton, L. W., & Greder, K. (2004). The food environment and food insecurity: Perceptions of rural, suburban, and urban food pantry clients in Iowa. Family Economics and Nutrition Review, 16, 41-48.
Greder, K., Garasky, S., Jensen, H., & Morton, L.W. (2002). Year one: Iowa food security report card project final report, FY 2002. Ames, IA: Iowa State University.
Hunger in America. (2006). Available at http://www.hungerinamerica.org/export/sites/hungerinamerica/ about_the_study/A2HNationalReport.pdf
Iowa State University Library, University Archives. (n.d.). Unpublished manuscript, "Professor P. G. Holden" p. 7.
Life Sciences Research Organization. Core indicators of nutritional status for difficult-to-sample populations. J Nutr. 1990;120 (suppl):1559-1600.
Miyamoto, A., Chun, L., Kanehiro, N., & Nakatsuka, C. (2006). Food pantries: Food and nutrition education in a non-traditional setting. Journal of Extension [On-line], 44(1): Article 1IAW2. Available at http://www.joe.org/joe/2006february/iw2.shtml
Morton, L. W., Oakland, M. J., Bitto, E. A., & Sand, M. (2003). Food in my community: A case study of a Des Moines neighborhood (Technical Report Number 1002). Iowa State University Extension, Department of Sociology, and Extension Family Nutrition Program. Retrieved December 8, 2004, from http://www.soc.iastate.edu/extension/publications/Des%20Moines%20Tech%20Report%201002.pdf
Nord, M. (2003). Food security in the United States: Measuring household food security. Retrieved July 14, 2004, from www.ers.usda.gov/Briefing/FoodSecurity/measurement
Nord, M., & Andrews M. (1999). Six-item short form of the food security survey module. USDA Economic Research Service Briefing Room. Retrieved March 7, 2007, from www.ers.usda.gov/Briefing/FoodSecurity/surveytools/index.htm#questionnaire
Nord, M., Andrews, M., & Carlson, S. (2006). Household food security in the United States, 2005 (Economic Research Report Number 29). Washington, DC: Economic Research Service United States Department of Agriculture. Retrieved March 6, 2007, from http://www.ers.usda.gov/publications/err29/
Raidl, M. A. (2003). The healthy diabetes plate. Moscow, ID: University of Idaho Extension.
Smith, C. A., Cudaback, D., Goddard, H. W., & Myers-Walls, J. (1994). National Extension parent education model. Manhattan, Kansas: Kansas Cooperative Extension Service. Retrieved March 7, 2007, from http://www.k-state.edu/wwparent/nepem/
Tarasuk, V. et al. (1998). Nutritional vulnerability and food insecurity among women in families using food banks. Toronto, Ontario, Canada: University of Toronto.
U.S.D.A. Foreign Agricultural Service (1998, February 13). Discussion paper on domestic food security. Retrieved May 3, 2006, from http://www.fas.usda.gov/icd/summit/1998/discussi.html