December 2005 // Volume 43 // Number 6 // Research in Brief // 6RIB10
Adoption of Integrated Pest Management Practices by South Carolina Cotton Growers
Abstract
The project reported here assessed the level of
adoption of integrated pest management (IPM) by South Carolina cotton growers.
A mail survey of growers was used to provide data on specific IPM practices
utilized. Growers were categorized as low, medium, or high IPM adopters based
on the frequency with which they implemented specific practices. The majority
of growers fell into the medium or high IPM rankings. However, only 7% of
respondents attained a high IPM ranking in the Cultural Pest Management section.
This suggests that future cotton IPM Extension efforts should be directed
towards increasing grower adoption of cultural IPM practices.
Introduction
Cotton is the second highest valued agricultural crop in South Carolina, with annual farm gate revenues of approximately $100 million (South Carolina Agricultural Statistics Service, 2003). The Clemson University Cotton Integrated Pest Management (CU-CIPM) Program has been in operation since 1972, the longest of any IPM program in the state. Cotton provides an excellent model for program evaluation because of the many changes in pest management practices that have occurred in the past three decades. These include boll weevil eradication, availability of "narrow-spectrum" insecticides having primary activity against key cotton pests but with reduced impact on beneficial arthropods, and the recent and widespread use of transgenic cotton varieties with pest resistance.
The CU-IPM research and Extension programs have continued to evolve to keep pace with these rapid changes in cotton pest management and the accompanying demand for information-intensive IPM programs. The objective of the project reported here was to assess the extent to which South Carolina cotton growers have adopted IPM practices recommended by the CU-CIPM Program.
Methods
The first step in our assessment was to list all available cotton IPM practices recommended by CU-CIPM Program specialists (Anonymous, 2004) and then to weight the practices based on importance to overall crop production (Boutwell & Smith 1981, Bauske, Zehnder, Sikora, & Kemble, 1998). Growers were then surveyed and classified as low, medium, or high IPM users based on a percentage score. A mail survey of cotton growers was developed based on methods standardized by Dilman (1978) with input from Clemson University cotton specialists.
The questions were designed to obtain demographic information and data on all aspects of the growers' cotton pest management practices, including scouting and recordkeeping, use of treatment thresholds and pesticide usage, and cultural pest management. The survey was divided into sections with questions pertaining to:
- Scouting and recordkeeping practices
- Cultural pest management practices
- Pesticide usage and treatment thresholds
- Pesticide application practices
Growers were asked to indicate the frequency with which they carried out a practice, and a number of open-ended questions were also included to assess their understanding of the concepts of IPM. The survey is available at <http://www.clemson.edu/scg/ipm/cottonipm.pdf>. A mailing list of all South Carolina cotton growers was obtained from the Clemson University Department of Plant Industry Boll Weevil Eradication Program. Surveys were mailed to 779 cotton growers throughout the state at the end of the 2002 cotton season.
Based on their responses, growers were placed into three categories of IPM adoption, low, medium, and high, according to procedures utilized by Bauske et al. (1998). In brief, distinctions among the three categories were determined by a weighting system that assigned values to each IPM practice based on its importance relative to all other IPM practices used. The assigned values (i.e., 1= low importance; 4 = high importance) were developed in consultation with state cotton research and Extension specialists. Scores were also weighted based on the frequency that growers reported implementing a practice (i.e., never = 0, seldom = 1, often = 2, always = 3).
Therefore, growers were categorized as "low", "medium," and "high" IPM adopters based on the collective importance values of their IPM practices and their reported frequency of implementation. This was done by multiplying the weighted "importance" score for each practice by the "frequency" score. Score ranges for low, medium, and high IPM adoption categories were determined by summing the IPM importance values for each category, then multiplying by the frequency values assigned for never and seldom (low IPM), often (medium IPM), and always (high IPM). For example, the total sum of the importance values assigned to all IPM practices was 165. Therefore, the low total IPM score range was 0-165 (165 multiplied by 0 and 1), the medium IPM score range was 166-330 (165 x 2 = 330), and the high IPM score range was 331-495 (165 x 3 = 495). Survey data were compiled in a Microsoft Access database for analyses. Additional information about the rating system methodology is available at <http://www.clemson.edu/scg/ipm/cottonipm.pdf>.
Results and Discussion
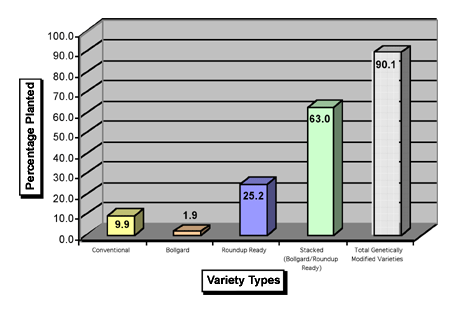
A total of 162 growers responded and provided usable surveys (21% response rate). The per farm acreage of the respondents ranged from 6 to 3,050 acres, with an average farm size of 516 acres. Approximately 90% of the reported cotton acreage was planted with genetically modified (GM) cotton varieties (Figure 1). Of these, varieties with the Bollgard� insect resistance gene or the Roundup Ready� tolerance gene constituted approximately 1.9% and 25.2% of the acreages grown, respectively. The remaining 63% of reported cotton acres were planted with stacked (multiple transgene) varieties.
Figure 1.
Percentage of Planted Cotton Varieties
Growers were asked to identify the most critical challenges affecting cotton production (Table 1). A majority of respondents indicated that insect pests were their most significant problem. The top four insect pests were sucking bugs in the Order Hemiptera (insects with piercing-sucking mouth parts) (71%), cotton bollworm (61%), tobacco budworm (32%), and thrips (19%). That hemipteran insects were reported as the most serious challenge to production reflects a shift in the cotton pest complex since the introduction of GM cotton varieties. Before the advent of GM cotton, hemipteran pests species were indirectly maintained at sub-threshold levels by insecticide sprays targeted against tobacco budworm and cotton bollworm. Because insecticide applications targeting lepidopterous pests are rarely needed in GM cotton, hemipteran insect populations may rise above threshold levels where boll damage may occur.
|
Problem |
1st |
2nd |
3rd |
4th |
||||
|
Type |
% |
Type |
% |
Type |
% |
Type |
% |
|
|
Insects |
Sucking bugs |
71% |
Bollworm |
61% |
Budworm |
32% |
Thrips |
19% |
|
Pathogens |
Seed-borne disease |
23% |
Nematodes |
12% |
Boll rot |
6% |
Virus disease |
2% |
|
Other |
Water |
64% |
Weed control |
19% |
Yields |
11% |
Cotton prices/ Input costs |
11% |
Table 2 shows the percentage of growers scoring in the Low, Medium, and High levels of IPM adoption for each of the different IPM sections. For all sections, the majority of growers fell into the medium or high IPM ranking. There was a generally similar distribution in the percentages of medium and high adopters except in the Cultural Pest Management section. Here, the major difference was that the majority of growers (87%) fell into the medium ranking, indicating they "often" used cultural IPM practices, while only 7% indicated that they "always" used recommended cultural practices.
|
Integrated Pest Management Ranking |
||||||
|
Questionnaire Section |
Low IPM Score |
% Growers |
Medium IPM Score |
% Growers |
High IPM Score |
% Growers |
|
Cultural Pest Management |
0 - 30 |
6 |
31 - 60 |
87 |
61 - 90 |
7 |
|
Scouting and Record Keeping |
0 - 30 |
5 |
31 - 60 |
54 |
61 - 90 |
41 |
|
Pesticide Usage |
0 - 46 |
2.5 |
47 - 92 |
60.5 |
92 - 138 |
37 |
|
Pesticide Application |
0 - 46 |
1.5 |
47 - 92 |
46.5 |
92 - 138 |
52 |
The Scouting and Record Keeping section focused on questions involving the record keeping practices of the grower along with pertinent scouting questions. The majority of growers (54 %) were categorized as medium IPM adopters, while 41 % fell into the high IPM adopter's category (Table 2). The Pesticide Usage section provided information on number of pesticide applications, and factors influencing pesticide application decision-making. Here, 60.5% and 37% of growers were categorized as medium and high-level IPM adopters, respectively.
The Pesticide Application section included questions pertaining to adherence to pesticide label guidelines, sprayer calibration, rotation of pesticide classes to avoid pest resistance, and utilization of spot treatments when feasible. Survey data from the Pesticide Application section indicated that 46.5% and 52% of growers fell within the Medium and High IPM categories, respectively.
The highest cumulative score achieved by a grower was 415 of a total possible score of 495; the lowest score was 190. A summary of cumulative scores for all sections indicated that the majority of growers (80%) were placed in the medium IPM category, with approximately 20% attaining scores that placed them in the high IPM category. None of the grower cumulative scores fell within the low IPM score range.
Conclusions
These results indicate that the majority of South Carolina cotton growers responding to the survey were classified as medium- or moderate-level adopters of IPM based on the importance of specific IPM practices they utilize and the frequency with which they implement these practices. Of all the pest management categories, Cultural Pest Management had the lowest percentage of growers (7%), indicating that they "always" implemented a practice. This suggests that future cotton IPM Extension efforts should be directed towards increasing grower adoption of cultural IPM practices. Greater implementation of cultural pest management practices to prevent and/or avoid pest problems in cotton before they occur would likely have the greatest impact contributing to further reduction in pesticide use.
Acknowledgements
Funding for this project was provided by the USDA CSREES Southern Region IPM Program. We are grateful to Clemson University cotton specialists Mike Jones, John Mueller, and Mitchell Roof, who provided information used to develop the cotton IPM survey and the weighting procedures for the IPM practices. We also sincerely thank the Clemson University Department of Plant Industry for their cooperation in this study.
References
Anonymous (2004). South Carolina cotton pest management recommendations. Available at: http://www.clemson.edu/scg/ipm/cotton.html
Bauske, M., Zehnder, G. M., Sikora, E. J., & Kemble, J. (1998). Southeastern tomato growers adopt integrated pest management. HortTechnology 8: 40-44.
Boutwell, J. L., & Smith, R. H. (1981). A new concept in evaluating integrated pest management programs. Bull. Entomol. Soc. Am. 27: 117-118.
Dilman, D. A. (1978). Mail and telephone surveys: The total design method. Wiley, New York.
South Carolina Agricultural Statistics Service. 2003. South Carolina agricultural statistics, 2001 revised, 2002 preliminary. AE 493. Department of Applied Economics & Statistics, Clemson University, Clemson, SC