June 2004 // Volume 42 // Number 3 // Research in Brief // 3RIB5
Use of a Randomized, Categorized Exam to Determine Horse Knowledge of 4-H Horse Show Participants
Abstract
The study focused on using a general knowledge exam to determine strengths
and weaknesses of 4-H youth in six New England states competing at
the Eastern States Exposition 4-H Horse Show. One hundred multiple-choice
questions were divided into 10 categories with 10 questions per category.
Questions were then randomized. Information regarding age, gender,
discipline, and years of attendance were collected and had some effect
on mean exam scores. The mean score results in each category provided
feedback on strengths and weaknesses of each state's 4-H youth. This
method may offer a way to track progress over time of 4-H youth.
Introduction
One of the culminating events of the year for the 4-H Horse Project in New England is the Eastern States Exposition 4-H Horse Show. The six New England states (Connecticut, Massachusetts, Maine, New Hampshire, Rhode Island, and Vermont) participate in horse fitting and showmanship and riding classes, compete in quiz bowl, and take a general knowledge exam. The general knowledge exam has historically been scored with ribbons awarded based on score. No other information was obtained from the general knowledge exam.
Therefore, the Connecticut Equine Extension Specialist and the Connecticut 4-H Horse Project Coordinator, an Extension Educator, decided to categorize the exam in order to determine strengths and weaknesses of 4-H youth. In this initial study, 10 categories were used: anatomy and physiology, breeding, colors, conformation, health and disease, history and evolution, nutrition, reproduction, tack and equipment and training and behavior. The categories were divided between the two authors of the exam. Questions were then randomized throughout the exam.
The objective of the study was to use the general knowledge exam to determine strengths and weaknesses in different categories of horse knowledge. This allows states to utilize this information to determine program planning. It also provides feedback to 4-H leaders that can help when planning club activities.
Materials and Methods
One hundred multiple-choice questions were divided into 10 categories with 10 questions in each category. Categories included anatomy and physiology, breeding, colors, conformation, health and disease, history and evolution, nutrition, reproduction, tack and equipment, and training and behavior. Questions were then randomized so that each category was distributed randomly throughout the exam. A committee of horse project leaders examined the exam to determine that it truly tested knowledge in these categories.
The test was administered to approximately 100 4-H youth. They had 2 hours to complete the exam; all completed the exam in the time allowed. Some general information about each 4-H youth was recorded, including name, gender, birth date, number of years attending the event, discipline (hunt seat, saddle seat, western, or junior leader) and state. Answers were recorded by 4-H youth using Scan-Tron© sheets.
Scan-Tron© sheets were then copied and scored by hand for the purposes of the contest. A Scan-Tron© machine was not available at the fairgrounds. Later the original exams were processed by the Scan-Tron© system for ease of data analysis. An average score for each category was calculated for each 4-H youth. These scores were averaged in order to determine results for each state. State results were given to the 4-H leaders of each state for distribution within the state.
Data were then entered into a statistical analysis software package (SAS). Data were analyzed using the general linear models procedure in SAS. Means that differed at P<0.05 were considered significantly different. Because there were not enough 4-H youth in every category by state, data were pooled to determine main effects of age, gender, discipline, and year of participation in the contest.
An attempt to measure reliability of the survey was done by evaluating the scores of participants on a random one-half of the categories to the other random one-half of the categories. These halves were randomly assigned to test one or test two. The test scores were compared utilizing the mixed procedure in SAS. The scores on test one were not significantly different (P=.4576). The similarity of scores on test one and two indicate that high scoring participants score high on both tests and that the general knowledge test is reliable in its current form.
Results
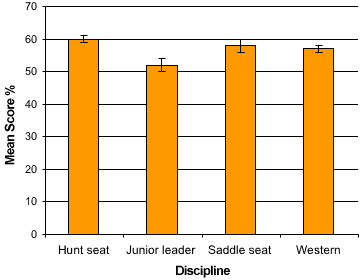
Age (P<0.01), discipline (P<0.01), and year of participation (P<0.01) differed significantly. Thirteen-, fourteen-, and fifteen-year-old participants had lower mean scores than did sixteen-, seventeen-, eighteen-, and nineteen-year old participants (Figure 1). There were no differences based on gender. For discipline, junior leaders scored lower (P<0.05) than participants who rode hunt seat, saddle seat, or western (Figure 2). Hunt seat riders scored higher (P<0.05) than western riders, but there were no other significant differences. No differences were found between first-time participants and previous participants. Scores of previous participants increased (P<0.05) until reaching a maximum score upon the third year of attendance. After that, no improvement was shown based on years of attendance (Figure 3).
Figure 1.
Mean General Knowledge Score Based on Age
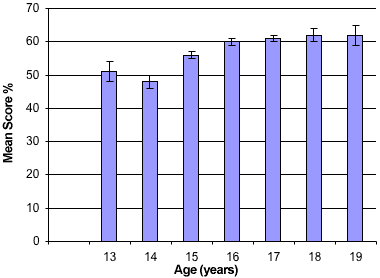
Figure 2.
Mean General Knowledge Score Based on Year in Attendance at ESE
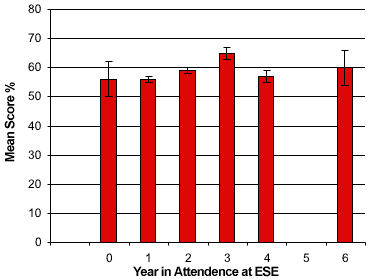
Figure 3.
Mean General Knowledge Score Based on Discipline
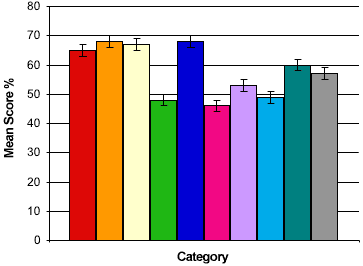
Mean state and category scores were different (P<0.01) as main effects. Two states had higher mean scores than any of the other participating states. This was followed by two middle-ranking states and two states with lower scores (Figure 4). Mean scores ranged from 52% to 68%. Mean score results in categories of knowledge were stratified into four distinct groups. The highest mean scores were in the categories of health and disease, breeds, colors and markings, and anatomy and physiology. The next highest mean scores were found in tack and equipment and training, followed by nutrition. The lowest mean scores were in reproduction, conformation, and history and evolution (Figure 5).
Figure 4.
Mean General Knowledge Score by State
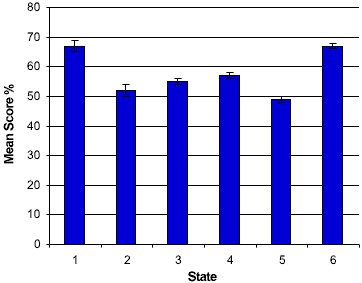
Figure 5.
Mean General Knowledge Score Based on Category
Conclusions and Implications
Age results were as expected, with older participants scoring higher than younger participants. Gender results were also as expected, showing no difference between male and female participants. Discipline results were not surprising in that it would be expected that junior leaders would score lower than hunt seat, saddle seat, or western participants, because they tend to be the youngest and (generally) least experienced group. It was surprising, however, that hunt seat participants scored higher than their western counterparts. This could be unique to this group of individuals; more data will need to be gathered to see if this difference remains significant.
It is also interesting that performance peaks at the third year of attendance and then shows no increase. This may indicate that maximal performance is achieved after 3 years of attendance. Participants with no previous experience had mean scores that did not differ from any of the years of attendance. It may be that new participants and participants who have attended up to 3 years may take the test more seriously and tend to prepare more diligently for the exam. More data are needed to determine if these results are unique to this particular group of participants.
Mean scores ranged from 52% to 68%, and there is room for improvement in every category. One goal of the people of the New England states could be for 4-H participants to achieve higher scores in every category. It should be determined if current expectations exceed the ability of 4-H youth.
Some states had higher mean scores than others and may be targeting certain categories of knowledge more effectively than others. The idea behind the study was that states could work together to improve weak areas through program planning. A state that scored high could work with a state that scored lower, or two states that scored lower could work together on their areas of weakness.
Participants had similar strengths and weaknesses in all categories. As mentioned previously, the highest mean scores were in the categories of health and disease, breeds, colors and markings, and anatomy and physiology. The next highest mean scores were found in tack and equipment, and training. Nutrition was the category with the next highest mean scores. The lowest mean scores were in reproduction, conformation, and history and evolution. This indicates that reproduction, conformation, and history and evolution are areas that require improvement in these participants. States could target these areas for program planning.
Each individual state leader was given results specific to his or her state for aid in program planning. It is hoped that these results will be shared with the 4-H leaders of the participants in the state to help these 4-H youth improve knowledge in weak areas and continue to do well in areas of strength.
More data needs to be gathered in the future. The method detailed in this study may be one means of tracking growth of an individual 4-H member. In the future, the organizers of this study hope to expand the study to include more categories of knowledge and learning styles on the exam. They also hope to develop educational packets targeted to each category to help states add to the knowledge base of 4-H youth. This system might also have potential for inclusion in hippology contests due to its simplicity and potential benefit to coaches, Extension educators, Extension specialists, and 4-H youth.
References
SAS Institute Inc. (1999-2001). The SAS system. Version 8. Cary, NC.