August 2004 // Volume 42 // Number 4 // Feature Articles // 4FEA2
Profiling Economic Capacity
Abstract
This article presents a method for creating economic capacity
profiles based on assessing the resources available to support local economic
development. Each profile incorporates four features of the local economy:
entrepreneurship, infrastructure, human resources, and business environment.
These four variables are evaluated through 20 indicators related to location.
Both qualitative and quantitative scoring methods are used for representing
the indicators, which become the basis for creating the profile. The outcome
is a "snapshot" of the economic capacity of the area under investigation.
These profiles are highly useful to Extension professionals wanting to improve
economic development in local areas.
Introduction
Many rural areas are affected by globalization and restructuring. Generally, stress comes from rapid change in the areas of technology, environmental factors, market dynamics, and government policies and ideologies. Still, economic development remains a local responsibility. Success is more likely if initiated by Extension professionals at the local level than elsewhere and depends largely on local circumstances.
By developing an Economic Capacity Profile, one looks at local circumstances from the inside out. An improved understanding of local economic capacity reveals conditions that are relevant for the complex of changes that continue in rural North America. Economic capacity profiles enable Extension professionals to "see" the economic capacity of each site. This information allows comparisons among and between different rural areas where other features (governance, social cohesion, natural resources, etc.) also play an important role in local vitality. The profiles also help rural residents to be aware of the resources and potential available in their local area.
Profiles are effective summaries of what can be a complicated set of information. They can be used by Extension professionals to generate questions that will yield useful results for local residents. As a communication tool, profiles are readily understood, with suitable graphics that present complex data in an accessible style. As a learning tool, profiles are hands-on, participatory devices that can increase awareness and encourage collaboration between Extension professionals and residents.
The profiles presented in this article are based on research undertaken as part of the New Rural Economy (NRE) Project (http://nre.concordia.ca), examining revitalization across rural Canada. Since 1997, a number of researchers have been gathering data about these sites as part of the NRE activity. Their methods include participant observation, household surveys, and key informant interviews.
The remainder of this article provides a description of the details for generating Economic Capacity Profiles, including the methods associated with profiling and the details related to the variables, indicators, and scoring. A profile for a hypothetical site is then presented.
Economic Capacity Profiles
The purpose of creating an economic capacity profile is to characterize features that support local economic development so that outreach strategies and programs can be designed. A review of the economic development literature reveals a wide range of local attributes examined from many perspectives (see, for example, Bryant, 1994; Westcoast Development Group, 1993; Walmsley, 1992). One may discuss, for example, location related to costs of regional supply and distribution, quality of life in relation to decision-making processes of firms, or access to low-cost, high-volume energy supply to meet industry-specific requirements. Throughout the literature, the importance of site-specific attributes is emphasized. Sorting through these attributes is a significant step in developing the Economic Capacity Profile.
Site-specific features that support economic development include resources located both within and at a distance from the site. To measure economic capacity it is useful to know, for example, if there is an industrial park within or near the site. Such information can be used in different ways with regard to an economic development strategy. For instance, if an industrial park does not exist in the site, a strategy may be to build one. If a park does exist, the strategy might focus upon marketing the site. Similarly, low wages in a site may be viewed as an indication of weak economic vitality, or they might also be seen as an asset to attract new business. With regard to economic development strategies, indicators therefore may be interpreted either positively or negatively--as an opportunity or challenge--it will depend on the context.
To look at local circumstances from the inside out is to focus upon site-specific factors that directly contribute to economic development without explicit regard for external requirements. A profile of economic capacity, therefore, is a strategy-neutral perspective of site-specific attributes that contribute to local economic development, i.e., the attributes are not based on industry- or firm-specific locational criteria.
Based on our analysis of the literature, four variables were identified as constituting economic capacity: level of entrepreneurship, human resources, infrastructure, and business environment. These four variables can be assessed through measures of 20 locational attributes (or indicators), discussed more fully in the following sections. The selection of these indicators was based on three factors:
- The indicators were consistently identified within the economic development literature;
- The indicators selected were strategy-neutral; and
- The indicators were based on readily available data to increase the ease of creating the Economic Capacity Profile.
The Economic Capacity Profile has the potential for further refinement and development in response to local circumstances and interests. For example, one might include access to health services as a specific indicator of local infrastructure. Extension professionals may want to use the structure underlying the Profile for a range of variables and indicators of their choosing and thereby customize the Profile to their needs.
Level of Entrepreneurship
A key feature of local economic development is the level of entrepreneurship. "Little will happen without local entrepreneurs" (Polèse, 1994). Entrepreneurs are people who can mobilize resources and turn ideas into viable businesses. Entrepreneurship is portrayed as a significant factor of North American historical development (Kent Sexton, & Vesper, 1982) and as a solution to present economic challenges (Nichol, 1999). Entrepreneurship is one way that rural areas will move from a traditional reliance on primary sector industry to small business activity in manufacturing and service that can provide new opportunities for employment (Reimer, 2000).
Although just what constitutes entrepreneurship and entrepreneurial characteristics is debated in the literature (Hornaday, 1982), it is possible to isolate certain local characteristics to serve as indicators for the level of entrepreneurship in a given site. Three indicators were selected.
- Level of self-employment--the number of self-employed persons compared to all employed individuals. The level of self-employment captures a majority of those who pursue entrepreneurial activity as independent business people in the site. A higher score indicates a higher level of business development skills and abilities.
- Availability of micro-financing--distance from site. Generally, access to capital is an important locational factor. Micro-financing is particularly significant because it minimizes costs and promotes selection criteria in favor of new, small businesses. Availability of micro-financing facilitates entrepreneurial activity.
- Employment outside of the primary sector--percentage of workforce not employed in the primary sector. According to Bryant (1994), a lack of employment diversity, such as found in single-industry, resource-based towns, can create an environment of uncertainty and unwillingness to invest. Employment outside of the primary sector (i.e., non-primary employment) indicates a level of diversity that supports entrepreneurial investment.
Human Resources
The concept of human resources captures an appreciation for the important contribution individuals make to the success of any business enterprise. The quality and availability of employees therefore need to be accounted for in any assessment of economic capacity (Welke & Douglas, 1999). Accessibility to an education system that trains people to meet local economic needs and opportunities is also critical. The education and training system is an important part of social resources since training can change and create opportunities (Bryant, 1994). Human Resources is closely tied to human capital and comprised of four indicators.
- Education level--education attainment among the population, expressed as the percentage of adult population with less than grade 9.
- Labor market--unemployment rate. The unemployment rate indicates the general health of the local economy. A healthier local economy is able to provide opportunities for more of its residents.
- Proximity to college or training centres--proximity to site. Access to post-secondary education and training centres is an important attribute that supports economic activity. The distance from the site to the institutions was used as a measure of accessibility.
- Proximity to university--proximity to site.
Local Infrastructure
Reliable utilities services, transportation, communications networks, and public services are all necessary elements for economic enterprises to operate. Important factors include water and sewage systems, public buildings (e.g., town hall, primary schools, recreation facilities), proximity to provincial or federal highways, local community paper, and Internet access. High schools are included here as a basic public service, rather than, for example, as an attribute of human resources.
- Availability of transportation--proximity to major airport, freight train, harbor.
- Access to public services--level of services available; proximity to site.
- Available communications--availability of local and regional papers; availability of Internet access; and speed of Internet access.
- Access to public buildings--level of services available; proximity to site.
- Proximity to high school--proximity to site.
- Availability of water/sewage systems--level of services available.
- Proximity to major highway--proximity to site.
Although some infrastructures contribute directly to economic activity, all attributes "should be seen as fundamentally necessary" for economic capacity (Bryant, 1994). Otherwise, enterprises must bear the added costs of sustaining these services.
Business Environment
Both formal and informal aspects of a supportive business environment contribute to economic capacity. Access to capital itself is not a major factor in predicting business success; knowing what to do with capital is important (Polèse, 1994). More concrete features (e.g., the presence of an industrial park and the services provided by economic development agencies) co-exist with the more informal aspects of support that arise from interactions with other businesses. According to Welke & Douglas (1999), support from Extension professionals and other organizations is important to overcome obstacles for economic development by enhancing networking and co-operation among enterprises and contribute to overall flexibility within the economic sector. For many economic reasons, it is important to be closer to other businesses for personal and daily contact.
The six indicators chosen aim to reflect both concrete and less formal aspects of Business Environment are:
- Access to industrial park--proximity to site. An industrial park is one of the top five important job-generating factors (Finsterbusch, Formichella, Huennen, & Ramsay, 1992). Therefore, it is important to know if a park exists within a site or how far the closest one is to the site. Generally, the agglomeration of business reflects the local demand for business activities, which may translate into more business for existing firms, or new firms responding to new opportunities.
- Level of commercial shopping--level available within the site. The level of commercial shopping available within the site is also an indicator of business demand.
- Access to financial institutions--proximity to site of banks and credit unions. Access to capital is essential for business development. Attitudes of major banks, cost factors, criteria, and non-financial barriers (e.g., gender) are aspects of accessibility. While banks are the most important source of financing, access to alternative sources, such as family and friends, is also important (Green, 1996). Consistent with this line of thinking, a distinction is made between banks and credit unions.
- Access to economic development agencies--proximity to site. Economic development agencies perform a critical support role for business activity. Compiling and distributing information, marketing and promotions, networking, policy making, administration, and site development are all important activities that facilitate both internal and external business activity.
- Proximity to urban center--proximity to site. Proximity to markets is often cited as a factor in economic development. Therefore, indicators of business environment include proximity to an urban center and concentration of retail activity.
- Concentration of retail activity--level of retail activity within site; proximity to site. The concentration of retail activity was selected as an indicator of the level of personal and daily contact. For example, if retail activity is dispersed or far from the site, the probability of personal and daily contact declines. The concentration of retail activity also reflects an aspect of structural diversity of local areas.
Methods
The general aim was to develop objective measures of site-specific economic capacity. The focus was on whether resources were present or not present, as well as how far the resources were from the site if not available within the site. Tables 1, 2, 3, and 4 summarize the variables, indicators, and the methods used for developing scores for each indicator.
For comparative purposes, absolute scores for indicators (e.g., unemployment rates, distance from site) were transformed into a score between 1 (low) and 5 (high). Several methods were used. Indicators were measured against either the provincial average to reflect regional differences or against the sample range to reflect relative differences. For example, unemployment rates vary by province. A 9 % unemployment rate might be a good situation for one area and bad for another. Hence, the unemployment rate was first transformed into a ratio using provincial averages and then scored using a scale. The high and low ends of the unemployment scale were based on the range of ratios of all the NRE sites. The NRE sample was accepted as representative of rural areas.
The scales for "proximity to site" were based on the range of distances for all NRE sites. The ranges were then divided into a five-point scale. Distances were not the same for all indicators. The different scales used to measure proximity reflect the relative importance of each indicator. For example, it was deemed that it is more important for high schools to be closer to the site than general public services. Similarly, being close to an urban center is more important than being close to an international airport. The different scoring methods are identified in each of the tables below.
As a tool for local development, Extension professionals can work with local residents to complete the Economic Capacity Profile. Familiarity with businesses and their activities is sufficient to complete the Profiles in conjunction with census statistics like unemployment rates and education levels.
|
Entrepreneurship |
||
|---|---|---|
|
Indicator |
Description & Data Source |
Scoring |
|
Level of self employment |
Level of self-employment is expressed as the number of self-employed
males and females compared to all employed individuals. Ratio calculated
based on provincial averages. |
Ranked. Scores assigned by quintiles: |
|
Micro-financing |
Distance from site in kilometers |
0 - >65km or not avail |
|
Non-primary employment |
Total employment in sectors outside the primary sector. Ratio calculated
based on provincial averages. |
Ranked. Scores assigned by quintiles: |
|
Human Resources |
||
|
Indicator |
Description & Data Source |
Scoring |
|
Education level |
Level of Grade 9 education. Ratio calculated based on provincial averages. Source: Statistics Canada Census 1996 |
Ranked. Scores assigned by quintiles: |
|
Labor market |
Level of unemployment. Ratio calculated based on provincial averages. Source: Statistics Canada Census 1996 |
Ranked. Scores assigned by quintiles: |
|
Proximity to College |
Distance in kilometers. |
5 - in site |
|
Proximity to University |
Distance in kilometers. |
5 - <50km |
|
Infrastructure |
||
|
Indicator |
Description & Data Source |
Scoring |
|
Transportation |
Distance in km from major airport (A), train - freight (F), and boat - harbor (B). Considers how many of these are in site or close to site. |
5 - 2 of 3 <50km |
|
Public services |
Proximity of various services, including social services, police, fire, ambulance, medical. |
5 - all in site |
|
Communications |
Presence/availability of internet service (dial up or high speed) and whether there is a local or regional paper. |
5 - high speed and local paper |
|
Public buildings |
Presence and proximity of public buildings, including town hall, recreation centre, sports facilities, hospital. |
5 - all in site |
|
High school |
Distance in kilometers. |
5 - in site |
|
Water/sewage system |
Level of service. |
5 - most of site |
|
Proximity to major highway |
Distance in kilometers. Considers whether the highway is a major or minor corridor route. |
5 - <10km to major highway |
| Business Environment | ||
|---|---|---|
|
Indicator |
Description & Data Source |
Scoring |
|
Industrial park |
Proximity to site in kilometers. |
5 - in site |
|
Commercial shopping |
NRE classification of retail activity. |
1 - minimum convenience |
|
Access to financial institution |
Presence and proximity of financial institutions, banks and credit union in particular. |
5 - bank and credit union in site |
|
Economic development agencies |
Accessibility to economic development agencies. Some agencies serve the site specifically. Other agencies may serve the area but not be within the site. |
5 - agency in site |
|
Proximity to urban center |
Distance in km; urban centre is one of at least 10,000 population |
5 - <25km |
|
Concentration of retail activity |
Concentration of retail activity, along a main street within the site, for example. |
5 - concentrated retail "main street" in site |
Creating the Profile
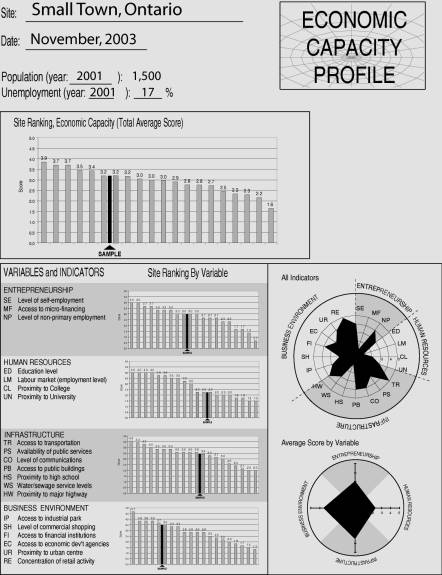
After calculating scores for each indicator, the results are used to create an Economic Capacity Profile, such as the one in Figure 1. The Profile is comprised of several charts illustrating different views of the same data. The scores of the site being analyzed are ranked against the scores of the 20 NRE sites. (Note: each bar in the charts represents a score for each NRE site.) The charts shown include: the site's total average score relative to the 20 NRE sites (top chart); the site's scores for each variable relative to the 20 NRE sites (four charts on lower left); the site's scores for each of the 20 indicators (the "All Indicators" chart, middle right); and, the site's average score for each variable (lower left). Collectively, the charts show how indicators relate to variables and how variables relate to each other and the overall economic capacity in the site.
The site Profile shown in Figure 1 represents characteristics of many small towns in North America. Overall, the site is doing well, as indicated by the overall ranking (second quartile) relative to the 20 sites. The overall capacity reflects the site's historical position as a rural center with a diversified manufacturing and service base. Restructuring in the "new rural economy" has eroded this base over the past 30 years, but still provides infrastructure to support new economic development.
The charts on the lower left side of the Profile show the site rank for each of Entrepreneurship, Human Resources, Infrastructure, and Business Environment. These rankings by variable reveal the site's relative strengths and weaknesses. The "All Indicators" chart is a composite of the 20 indicators. Each "spoke" of the radial graph represents one of the 20 indicators (e.g., SE = level of self-employment). The chart shows that the site has a mix of scores. The higher score for Business Environment reflects the site's concentrated retail activity along "main street" as well as its proximity to an urban center. The site is among the lower scores for human resources, which reflects a relatively high unemployment rate and, to some extent, an increase in the population of retired peoples.
Figure 1.
Economic Capacity Profile (sample)
Conclusion
Rural North America continues to face the challenges and opportunities related to increasing globalization, demographic transformations, an aging infrastructure, and continued resource depletion. Enhanced understanding of local potential for economic development can generate a firm sense of direction, but much of what underlies local economic success remains complex. New insights into effective community economic development are necessary for the regions and communities within rural areas to survive and prosper. The economic capacity profiling described in this article is offered as one tool that can help Extension professionals to develop strategies and programs for sustainable settlements.
The composition of the Profiles offers an innovative contribution to the field of Extension. As a tool for development, the Profile arranges data in a single account of local strengths and weaknesses. As a tool for comparative analysis, the Profile synthesizes multiple perspectives. Data are analyzed by overall score, variable scores, and indicator scores. As a facilitation tool, the multi-dimensional approach acts as a mirror highlighting local characteristics with the simultaneous ability to inspect details. A story of local economic capacity unfolds in the process.
References
Bryant, C. R. (1994). The locational dynamics of community economic development." In Douglas, D. J. Community economic development in Canada: Volume 1. Toronto, ON: McGraw-Hill Ryerson.
Finsterbusch, K., Formichella, C., Huennen, D., & Ramsay, M. S. (1992). An evaluation of a wide range of job creating activities for rural counties. Journal of the Community Development Society 23(1):103-22.
Green, G. P. (1994). Is small beautiful? Small business development in rural areas. Journal of the Community Development Society 25(2):155-71.
Hornaday, J. A. (1982). Research about living entrepreneurs. In Kent, C. A., Sexton, D.L., & Vesper, K. H. (Eds.), Encyclopedia of entrepreneurship, Englewood Cliffs, N.J.: Prentice-Hall.
Kent, C. A., Sexton, D.L., & Vesper, K. H. (Eds.) (1982). Encyclopedia of entrepreneurship, Englewood Cliffs, N.J.: Prentice-Hall.
Nichol, P. (1999). Introduction: Huron County in the new rural economy. In Fuller, T. & Nichol, P., Dynamics of the new rural economy. Guelph, ON: University School of Rural Planning and Development, University of Guelph.
Polèse, M. (1994). Community economic development revisited: The preconditions for success. In Galloway, B. & Hudson, J., Community economic development: Perspectives on research and policy. Toronto: Thompson Educational Publishing, Inc.
Reimer, B. (2000). IWG self-employment project component II: Statistical summary report. Montreal: University of Concordia.
Walmsley, A. (1992). Bright lights, best cities. Report on Business, August 1992, 42-58.
Welke, S. M. & Douglas, D. J. (1999). New rural enterprises in Huron County. In Fuller, T. & Nichol, P., Dynamics of the new rural economy. Guelph, ON: University School of Rural Planning and Development, University of Guelph.
Westcoast Development Group (1993). Entrepreneurial communities: A handbook for local action. Vernon, BC: Westcoast Development Group.