February 2002 // Volume 40 // Number 1 // Research in Brief // 1RIB3
Factors Affecting the Location of Precision Farming Technology Adoption in Tennessee
Abstract
A group of Tennessee farmers indicated that they would benefit from downloadable digitized soil maps and university precision farming training programs for themselves, agricultural laborers, and agribusiness personnel. The University of Tennessee Institute of Agriculture is interested in knowing where in Tennessee to allocate its scarce resources to enhance precision farming programs. Data from a survey of Extension Agents and the Census of Agriculture were use to develop five Logit regression models to estimate the probabilities of precision farming technology use in Tennessee's 95 counties. Counties with estimated probabilities greater than 0.5 would be good candidates for precision farming programs.
Introduction
Precision farming uses information about the differences in soil and other characteristics within a farm field to make management choices. It often uses computers and other digital technologies to aid in decision making and applying crop inputs such as seed, fertilizer, lime, and chemicals more accurately (Khanna, Epouhe, & Hornbaker, 1999; Swinton & Lowenberg-DeBoer, 1998). More precise placement of inputs with precision farming may increase farm profits and reduce adverse environmental consequences of crop production (Watkins, Lu, & Huang, 1998). However, the key to farmer adoption of site-specific farming is the profitability of the technology (Roberts, English, & Mahajanashetti, 2000).
Available information on where precision farming practices have been adopted is primarily for a few higher value crops and for several crops grown in the Midwestern United States (Khanna, Epouhe, & Hornbaker, 1999). Little information currently exists on where precision farming practices have been adopted in the southern United States.
A March 1999 survey of Tennessee Agricultural Extension Agents helped overcome this lack of information for Tennessee. That survey identified 284 producers using at least one precision farming technology in 38 of Tennessee's 95 counties (English, Roberts, & Sleigh, 2000). An April-May 1999 companion survey found that firms providing precision farming services to Tennessee farmers expected the demand for their services to grow rapidly over the next 5 years (Roberts, English, & Sleigh, 2000).
A focus group of 18 Tennessee farmers who had adopted at least one precision farming technology was conducted in July 1999. One purpose of the meeting was to improve understanding of how Tennessee farmers might benefit from using these technologies and how the University of Tennessee can help them make better decisions concerning these technologies. The discussion indicated that farmers would benefit from:
- An upgraded, well trained, and informed agricultural workforce capable of calibrating, operating, and maintaining their equipment,
- Well-trained and -informed agribusiness personnel capable of calibrating, operating, and maintaining their firms' equipment and giving accurate technical advice,
- Standardized equipment and software,
- Regular training for agricultural laborers, agribusiness personnel, and owner-operators in the use of these technologies, and
- Digitized soils maps available on the Internet for farmers to download and overlay on other field maps.
With the anticipated growth in demand for precision farming technologies, the question of interest is, "Where in Tennessee should we focus our scarce resources?" For example, which counties should receive priority in creating downloadable soil maps and in receiving precision farming training programs? The objective of the research reported here was to identify factors that influence the geographic location of precision farming technology adoption in Tennessee and, given those factors, estimate the probabilities of precision farming technology adoption for Tennessee's 95 counties. Estimation of these probabilities could help establish county priorities for precision farming programs.
Methods
Other studies have identified farmer characteristics associated with adoption (Daberkow & McBride, 1998; Khanna, 2001). In this study, however, the focus was on where precision farming technologies have been used and how location characteristics influence the probabilities of adoption among counties. Data from the simple March 1999 survey of Agricultural Extension Agents and the Census of Agriculture were used to analyze the effects of location characteristics on the likelihood of precision farming technologies being adopted by farmers in Tennessee's counties.
A farmer's decision to invest in precision farming technology is related to its potential to earn the farmer a profit. Assume the probability of precision farming technology adoption by farmers depends on location characteristics that affect crop-farm profitability according to a cumulative logistics probability function (Pindyck & Rubinfeld, 1998, pp. 307-308). The impacts of the location characteristics on the probability of adoption can be estimated from a Logit regression model (Pindyck & Rubinfeld, 1998, pp. 309-317). The probability of adoption for a county can then be estimated using those estimated impacts along with the location characteristics of the particular county (Pindyck & Rubinfeld, 1998, pp. 309-317).
Five Logit regression models were estimated. Each model had a dependent variable with a value of 1 for Tennessee counties with at least one farmer using a yield monitor with GPS (Global Positioning Systems), a yield monitor without GPS, grid soil sampling, variable rate fertilizer or lime application, or any precision farming technology, and a value of 0 for counties with no farmers using the respective technologies (Table 1). Data required to form the dependent variables were obtained from the aforementioned survey of Tennessee Agricultural Extension Agents. Two weeks prior to the telephone survey, Extension Agents were informed by mail about the questions that would be asked and about Extension Administration support for the survey. The response rate was 100%.
Data for the explanatory variables were obtained from the 1997 Census of Agriculture (U.S. Department of Agriculture, 1999). These location characteristics are reported in Table 1. Gibson and Knox Counties were chosen as examples to illustrate the extremes of precision farming technology adoption in Tennessee. Gibson County had several farmers using most of the technologies analyzed, while Knox County had no farmers using these technologies.
Table 1.
Variable Definitions and Other Information for Tennessee and Gibson and
Knox Counties
|
Variable |
Definition |
Hypo-thesis |
95-County Mean |
St. Dev. |
Gibson Co. |
Knox Co. |
|
Yield Monitor/GPS |
1 if at least one farmer in county used yield monitor with GPS; 0 otherwise |
0.22 |
0.42 |
1 |
0 |
|
|
Yield Monitor/Out GPS |
1 if at least one farmer in county used yield monitor without GPS; 0 otherwise |
0.25 |
0.44 |
1 |
0 |
|
|
Grid Soil Sampling |
1 if at least one farmer in county used grid soil sampling; 0 otherwise |
0.29 |
0.46 |
1 |
0 |
|
|
Variable Rate Application |
1 if at least one farmer in county used variable rate fertilizer or lime; 0 otherwise |
0.19 |
0.39 |
0 |
0 |
|
|
Any Precision Farming Technology |
1 if at least one farmer in county used any precision farming technology; 0 otherwise |
0.39 |
0.49 |
1 |
0 |
|
|
Percentage of County Land in Farms |
Land in farms as a percentage of county land area (%) |
_ |
42.57 |
19.20 |
72.10 |
27.00 |
|
Total Cropland |
Total cropland (1000 acres) |
_ |
74.42 |
53.11 |
249.10 |
53.03 |
|
Livestock and Poultry Sales |
Sales of livestock, poultry, and their products ($1,000,000) |
å |
10.71 |
11.52 |
8.92 |
6.57 |
|
Percentage of Farmland in Crops |
Cropland as a percentage of total land in farms (%) |
_ |
60.04 |
11.94 |
89.58 |
60.39 |
|
Percentage of Farmland in Large Farms |
Land in farms of more than 259 acres as a percentage of total land in farms (%) |
_ |
49.72 |
18.21 |
83.30 |
24.48 |
|
Value of Crop Sales/Acre |
Value of crop sales per harvested acre ($100) |
_ |
2.52 |
1.81 |
2.78 |
3.90 |
|
Full-Owner Farmers |
Number of farmers harvesting cropland who are full owners (farmers) |
_ |
382.18 |
270.05 |
321.00 |
546.00 |
|
Part-Owner Farmers |
Number of farmers harvesting cropland who are part owners (farmers) |
å |
173.46 |
103.11 |
232.00 |
258.00 |
|
Tenant Farmers |
Number of farmers harvesting cropland who are tenants (farmers) |
å |
34.00 |
24.42 |
57.00 |
40.00 |
|
Land Owned Minus Land Rented |
Acres in part-owner farms that are owned minus acres rented (1000 acres) |
_ |
1.73 |
17.51 |
-57.88 |
1.81 |
Six location variables were included in the Logit models to capture resource differences among counties and, hence, the relative potential for farmers to earn higher profits from adopting precision farming technology (Table 1). Percentage of County Land in Farms attempted to capture the general importance of agriculture within a county and was hypothesized to positively influence the likelihood of adoption. Total Cropland was hypothesized to positively influence the odds of adoption within a county, while Livestock and Poultry Sales were hypothesized to negatively impact adoption. Percentage of Farmland in Crops was hypothesized to positively influence adoption. Percentage of Farmland in Large Farms was hypothesized to positively impact adoption because larger farmers are more likely to have the resources to cost effectively use these technologies and are more likely to be in a position to bear the risk. Finally, Value of Crop Sales/Acre was hypothesized to positively influence adoption.
Four tenure variables were specified. Adoption was considered more likely on owned cropland than on rented cropland. Therefore, Full-Owner Farmers was hypothesized to positively influence adoption in a county, while Part-Owner Farmers and Tenant Farmers were hypothesized to negatively influence adoption. Finally, part-owner farmers renting smaller amounts of land compared to the amounts of land owned were considered more likely to adopt precision farming technologies. Therefore, Land Owned Minus Land Rented was hypothesized to positively influence the likelihood of adoption.
All regressions were highly significant, and percentages of concordant predictions were all greater than 91% (Table 2). The Logit models had from two to six significant location variables. Only Value of Crop Sales/Acre had significant coefficients with unexpected signs. Higher valued crops such as tobacco, nursery crops, fruits, and vegetables are typically produced on smaller fields relative to row crops and in Tennessee counties where row crops are relatively unimportant. The technologies evaluated were not typically used on small fields in counties where these higher valued crops are important.
Table 2.
Logit Regressions for the Location of Precision Farming Technology Adoption
in Tennessee
a Variables are defined in Table 1. |
||||||||||||||||||||||||||||||||||||||||||||||||||||||||||||||||||||||||||||||||||||||||||||||||||||||
Estimated adoption probabilities, evaluated at the means of the Tennessee county data and for Gibson and Knox Counties, are presented in Table 3. When evaluated at the means of the county data, probabilities of farmers in the average Tennessee county adopting these technologies ranged from 0.093 for Yield Monitor/Out GPS to 0.431 for Any Precision Farming Technology. The estimated probabilities for Gibson County ranged from 0.703 for Variable Rate Application to 0.999 for Grid Soil Sampling. Knox County had very low estimated adoption probabilities, ranging from almost zero for Yield Monitor/Out GPS to 0.015 for Yield Monitor/GPS. Estimated adoption probabilities for Gibson and Knox Counties followed expected patterns, given differences in county location characteristic (Table 1).
Table 3.
Estimated Adoption Probabilities at the 95-County Means for Tennessee and
for Gibson and Knox Counties
a Variables are defined in Table 1. |
||||||||||||||||||||||||||||||||||||
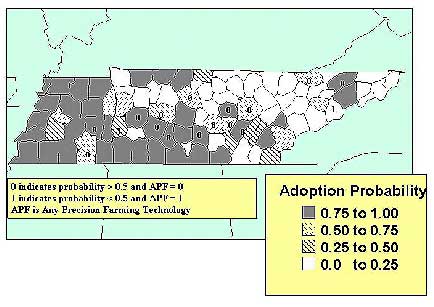
The map in Figure 1 shows where precision farming technology adoption was predicted to be more or less likely in Tennessee. Counties with high estimated probabilities of adoption (greater than 0.5) were located mostly in the western and central portions of the state. Adoption was estimated to be less likely in the more mountainous eastern portion of the state, although a few counties in that area had high estimated adoption probabilities.
Figure 1.
Estimated Precision Farming Adoption Probabilities for Tennessee Counties
The University of Tennessee may want to target its programs toward counties with estimated adoption probabilities greater than 0.5, where they would most likely benefit farmers, agribusiness personnel, and the agricultural workforce in general. Counties with estimated The University of Tennessee may want to target its programs toward counties with estimated adoption probabilities greater than 0.5, where they would most likely benefit farmers, agribusiness personnel, and the agricultural workforce in general. Counties with estimated adoption probabilities less than 0.25 would not likely be fruitful areas to target in the near future. Those counties with estimated probabilities between 0.25 and 0.5 may be fruitful for precision farming technology adoption in the future and should be reevaluated over time and as resources permit.
Between 11 and 18 counties with estimated adoption probabilities greater than 0.5 did not have farmers using precision farming technologies (Table 4 and Figure 1). The high estimated adoption probabilities for these counties, coupled with the apparent unavailability of firms providing precision farming services or farmers using their own equipment, suggest that these counties may be profitable areas for expansion of precision farming. Rather than emphasizing training programs or downloadable digitized soil maps in these counties, perhaps information-oriented programs to help farmers and agribusiness firms make decisions about adoption would be more important at the outset. For example, education programs that emphasize the costs and benefits of yield monitoring technology, grid or management zone soil sampling, and variable rate application of inputs would be useful in providing information to farmers who are considering the adoption of these technologies.
Table 4.
Estimated Adoption Probabilities Compared with Extension Agent Survey Results
a Technology Variable refers to the variable in the left column of this table. Variables are defined in Table 1. |
|||||||||||||||||||||
To meet the anticipated growth in demand for precision farming technologies revealed by an April-May 1999 survey of agribusiness firms, the University of Tennessee is interested in knowing where to concentrate its information and training resources. Data from a March 1999 survey of Agricultural Extension Agents and the 1997 Census of Agriculture were used to develop five Logit regression models to estimate the probabilities of Tennessee counties having farmers adopting various precision farming technologies.
Probabilities estimated from these models can help identify regions of the state where favorable factors exist for the adoption of precision farming technologies. The estimated adoption probabilities could be used in deciding where to target precision farming information and training programs. According to model predictions, counties targeted would be those with sufficient crop acreage, land in large farms, and farmers who own the land they farm.
The simple survey methods and Logit analysis presented in this article could be used by other states to help prioritize the geographic allocation of their precision farming program resources.
Daberkow, S. G., & McBride, W. D. (1998). Socioeconomic profiles of early adopters of precision agriculture technologies. Journal of Agribusiness, 16:151-68.
English, B. C., Roberts, R. K., & Sleigh, D. E. (2000). Spatial distribution of precision farming technologies in Tennessee. Tennessee Agr. Exp. Sta. Res. Rep. 00-05.
Khanna, M. (2001). Sequential adoption of site-specific technologies and its implications for nitrogen productivity: A double selectivity model. American Journal of Agricultural Economics, 83:35-51.
Khanna, M., Epouhe, O. F., & Hornbaker, R. (1999). Site-specific crop management: Adoption patterns and incentives. Review of Agricultural Economics, 21:455-472.
Pindyck, R .S., & Rubinfeld, D. L. (1998). Econometric models and economic forecasts, 4th Ed. New York: McGraw-Hill.
Roberts, R. K., English, B. C., & Mahajanashetti, S. B. (2000). Evaluating the returns to variable rate nitrogen application. Journal of Agricultural and Applied Economics, 32:133-143.
Roberts, R. K., English, B. C., & Sleigh, D. E. (2000). Precision farming services in tennessee: results of a 1999 survey of precision farming service providers. Tennessee Agr. Exp. Sta. Res. Rep. 00-06.
Swinton, S. M., & Lowenberg-DeBoer, J. (1998). Evaluating the profitability of site-specific farming. Journal of Production Agriculture, 11:439-446.
U.S. Department of Agriculture. (1999). 1997 census of agriculture: Tennessee state and county data. National Agricultural Statistics Service. AC97-A-42. Washington D.C.: U.S. Government Printing Office.
Watkins, K. B., Lu, Y. C., & Huang, W. Y. (1998). Economic and environmental feasibility of variable rate nitrogen fertilizer application with carry-over effects. Journal of Agricultural and Resource Economics, 23:401-426.