August 2002 // Volume 40 // Number 4 // Tools of the Trade // 4TOT4
Producing Customized County Reports the Easy Way
Abstract
Have you ever wanted to create reports for a number of locations
using the same layout and background information but location-specific data?
Traditionally, doing so was a difficult, time-consuming, and error-prone process.
Today's technology, however, makes it easier than ever before. This article
describes how linking data in Excel spreadsheets to Word documents allowed
the authors to create customized Situation and Trends reports for each of
the 105 Kansas counties.
Background
One of the challenges of serving a statewide network of county Extension offices is producing county-level data to support agent programming. In many states, a central office is responsible for providing such information. The Office of Local Government at Kansas State University is one such entity. As such, the Office periodically produces county Situation & Trends reports. These reports contain county-level demographic, economic, and other data to assist agents with program planning.
Originally, the report was a single volume that presented table after table of data for all 105 Kansas counties along with a general discussion of statewide trends. Later, reports were produced for each Kansas county, but readers were still forced to identify and interpret the data for their county.
In talking with agents, they made it clear that they valued the data in the report but wanted more county-specific interpretation. Thus, in planning the most recent update, we sought to efficiently produce a report highlighting each county's economic and social situation and any changes over time while making it as understandable and informative as possible.
As described below, we linked data in Excel spreadsheets to Word documents to do so. The resulting reports mix text and graphics and are more comprehensive than their predecessors. Each 79-page report includes information on the county's population, income, local economy, housing, household composition, education, health, social environment, public finance, and agriculture. All 105 county reports are available for viewing at: http://www.oznet.ksu.edu/direct/Sit&Trends.htm.
The Process
Following is a step-by-step guide to the process we use to produce customized county reports. Recognize that before engaging in this process, time must be spent determining the data and other information to be included in the reports.
1. Organize Data in Excel
Data is organized in a traditional spreadsheet layout. As shown in Table 1, county names are placed in the leftmost column and variable names in the top row. Blank rows or columns, borders, shading, and other formatting do not alter the effectiveness of Excel formulas.
Table 1.
Data Spreadsheet
|
A |
B |
C |
D |
|
|---|---|---|---|---|
|
1 |
County |
1990 |
2000 |
% Change |
|
2 |
Allen |
14,638 |
14,385 |
-1.7% |
|
3 |
Anderson |
7,803 |
8,110 |
3.9% |
|
4 |
Atchison |
16,932 |
16,774 |
-0.9% |
|
5 |
Barber |
5,874 |
5,307 |
-9.7% |
|
6 |
Barton |
29,382 |
28,205 |
-4.0% |
2. Write Excel Formulas
The next step in the process is writing formulas that perform various functions. Formulas are placed in a separate spreadsheet to avoid confusion but should be in the same Excel workbook as the data spreadsheet. In Table 2, values in column B are the result of formulas presented in the rightmost column. These formulas typically are not displayed, but we present them here to aid understanding.
Two types of formulas are used. The first are lookup formulas (=VLOOKUP in Table 2). These formulas search for a value in the leftmost column of a table of data and return a value in the same row from a column you specify in the table.
Basically, the first formula below instructs the program to find the contents of cell B1 (Atchison) in the first column of the data table (range A2:D6 from Table 1) and return the value from column 2 of that row (1990 Population). These formulas allow us to gather all the data needed to generate a specific county report in one spreadsheet. We also use lookup formulas to insert county data into tables and as the source of data for figures.
The second type of formulas use the data extracted by the lookup formulas in some way. These formulas may determine which text to enter (=IF in Table 2) or format data for entry in the Word document (=ABS in Table 2). This allows us to customize individual sentences in the report to conditions in the county rather than simply making generalizations. The examples presented in Table 2 determine whether the population increased or declined from 1990 to 2000 and ensure the percent change is in absolute terms for entry. These examples are relatively simple, but with nested IF statements, etc. formulas of this type can be quite complex.
Table 2.
Formula Spreadsheet
|
A |
B |
Formula in Column B |
|
|---|---|---|---|
|
1 |
County |
Atchison |
|
|
2 |
1990 Population |
16,932 |
=VLOOKUP($B$1,Data!$A$2:$D$6,2) |
|
3 |
2000 Population |
16,774 |
=VLOOKUP($B$1,Data!$A$2:$D$6,3) |
|
4 |
% Change |
-0.9% |
=VLOOKUP($B$1,Data!$A$2:$D$6,4) |
|
5 |
|||
|
6 |
declined |
=IF($B$4>0.0%,"increased ","declined ") |
|
|
7 |
0.9% |
=ABS($B$4) |
3. Paste Formulas into Master Word Document
Once all formulas are in place, they are copied and pasted into a master Word document creating links that allow data to be updated for each county.
Before copying data from Excel, it is important to ensure that the font type/size and number formatting in the spreadsheet match that desired in the Word document. To copy a cell or group of cells from the Excel spreadsheet, highlight the cell(s) to be copied and click "Copy" under "Edit."
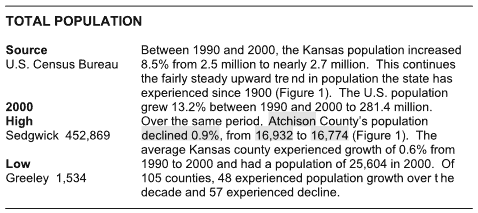
To paste a single cell (B6 in Table 2), place the cursor at the appropriate location (line 7 in Figure 1) and click "Paste Special" under "Edit." From the resulting dialog box, select "Paste Link" and "Formatted Text (RTF)," then click "OK." The resulting text should be formatted and placed correctly. If not, go back to Excel, make changes, and repeat the procedure. When running the cursor over the document, linked objects are identifiable as they are displayed in a shaded box (Figure 1).
Figure 1.
Atchison County Report
 |
To paste a table or figure, place the cursor at the appropriate location and click "Paste Special." From the "Paste Special" dialog box, select "Paste Link" and "Microsoft Excel Worksheet Object," then click "OK." Though the table or figure should be formatted properly, it may take some trial and error to size it correctly. Resizing should be done in Excel because doing so in Word affects font sizes and may distort the image. To add a border, center the table or figure, etc., click "Object" under "Format" in Word.
To see and manage all links in the document, click "Links" under "Edit." The resulting dialog box shows all links in the document, their source files, and how they are updated. When updated automatically, linked objects update every time the file is opened and any time the linked object changes while the file is open. Updating links manually provides more control over when updates are completed and prevents accidental updates. To set links for manual updating, highlight each link and select "Manual." When finished, click "OK" to close the dialog box.
4. Generate County Reports
Once links have been set up in the master Word document, creating a county report is simply a matter of updating. First, enter a county name in formula spreadsheet (cell B1 in Table 2) to update data for the county of interest. Then, save the master Word document under a new name (Atchison County Report). Open the "Links" dialog box by clicking "Links" under "Edit" and select all links in the document using the shift key. Click "Update Now" to update all linked objects in the document. This may take some time, depending on the number of linked objects.
By entering another county name in the formula spreadsheet (cell B1 in Table 2), the data is updated and the next report can be prepared following the same procedure.
Conclusions
Following initial setup, we have found this a relatively quick and easy way to produce custom reports. In addition to the county Situation & Trends reports, we use this process to annually produce Fiscal Conditions and Trends reports for each Kansas county. Feedback suggests that agents and others appreciate having reports tailored to their county.
This is not to say that the process is problem free. It requires considerable time to write formulas and set up links. In addition, linked objects can be touchy. Still, it is a great improvement over past efforts, and we feel the finished product is worth the time and effort.